Obstructive apneas produce high negative intrathoracic pressure that imposes an afterload burden on the left ventricle. Such episodes might produce structural changes in the left ventricle over time. Doppler echocardiograms were obtained within 2 months of attended polysomnography. Patients were grouped according to apnea–hypopnea index (AHI): mild/no obstructive sleep apnea (OSA; AHI <15) and moderate/severe OSA (AHI ≥15). Mitral valve tenting height and area, left ventricular (LV) long and short axes, and LV end-diastolic volume were measured in addition to tissue Doppler parameters. Comparisons of measurements at baseline and follow-up between and within groups were obtained; correlations between absolute changes (Δ) in echocardiographic parameters were also performed. After a mean follow-up of 240 days mitral valve tenting height increased significantly (1.17 ± 0.12 to 1.28 ± 0.17 cm, p = 0.001) in moderate/severe OSA as did tenting area (2.30 ± 0.41 to 2.66 ± 0.60 cm 2 , p = 0.0002); Δtenting height correlated with ΔLV end-diastolic volume (rho 0.43, p = 0.01) and Δtenting area (rho 0.35, p = 0.04). In patients with mild/no OSA there was no significant change in tenting height; there was a borderline significant increase in tenting area (2.20 ± 0.44 to 2.31 ± 0.43 cm 2 , p = 0.05). Septal tissue Doppler early diastolic wave decreased (8.04 ± 2.49 to 7.10 ± 1.83 cm/s, p = 0.005) in subjects with moderate/severe OSA but not in in those with mild/no OSA. In conclusion, in patients with moderate/severe OSA, mitral valve tenting height and tenting area increase significantly over time. This appears to be related, at least in part, to changes in LV geometry.
Obstructive sleep apnea (OSA) has adverse effects on left ventricular (LV) diastolic function and global LV function. However, aside from producing increased wall thickness, there is little information available on the effects on left heart structure. We tested the hypothesis that moderate to severe OSA over time can lead to changes in mitral valve tenting height and area in association with changes in LV geometry.
Methods
This prospective longitudinal study recruited subjects from the Sleep Disorders Center at Albert Einstein Medical Center from January 2008 through May 2010. All had sleep tests ordered on clinical grounds and none had a previously diagnosed sleep disorder. Exclusions included (1) any evidence of coronary disease, (2) any mitral leaflet disease, and (3) decreased ejection fraction for any reason. Demographic and clinical data were collected but no attempt was made to control medical therapy. Subjects underwent Doppler echocardiography shortly after polysomnography and again ≥6 months after the initial study. For those prescribed continuous positive airway pressure, compliance was measured by interrogation of the device or “smartcard.” Because only 4 subjects were compliant (>4 hours/night), the present study reflects the natural history of untreated severe OSA.
Polysomnography was performed using the VIASYS (CareFusion Respiratory Yorba Linda, California) SomnoStar Pro Sleep System (SomnoStar 9-1b). Electroencephalogram, electro-oculogram, and electromyogram were monitored for sleep staging. Nasal pressure monitoring, chest wall movement, abdominal movement, snoring, and oxygen saturation were recorded for respiratory assessment. Electrocardiogram and tibial electromyogram were monitored for cardiac arrhythmias and nocturnal limb movements, respectively. Studies were interpreted according to standards of the American Academy of Sleep Medicine. Presence and severity of OSA were established based on the apnea–hypopnea index (AHI): AHI <5 = no OSA, AHI ≥5 to <15 = mild OSA, AHI ≥15 to <30 = moderate OSA, and AHI ≥30 = severe OSA. Interpretation of all polysomnograms was performed by board-certified sleep medicine physicians.
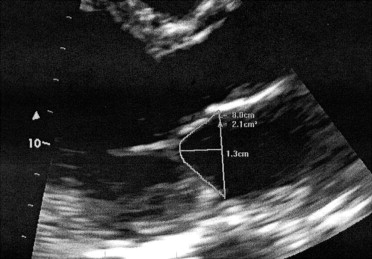
Two-dimensional and Doppler echocardiography were performed according to American Society of Echocardiography standards. Mitral valve tenting area was measured in midsystole in the parasternal long-axis view as the area bounded by the closed mitral leaflets and a line connecting the annular attachment points of the 2 leaflets. Tenting height was defined as the distance from that line to the point of coaptation of the leaflets ( Figure 1 ) . Left atrial dimension was measured as the diameter of the left atrium in systole in the parasternal long-axis view. Left atrial volume was measured in apical views according to the biplane area–length method. LV long axis was measured at end-diastole from the mitral annular plane to the apex in the 4-chamber view. LV short axis was measured in the same view as the diameter of the left ventricle (endocardium to endocardium) at the tips of the open mitral valve leaflets. LV end-diastolic volume and end-systolic volume were measured using the modified Simpson biplane method. The interpapillary muscle distance of the left ventricle was measured at end-diastole in the parasternal short-axis view by drawing a line through the papillary muscles and measuring between the LV endocardial borders where the papillary muscles attached. Tissue Doppler measurements included the systolic wave and early diastolic wave (E′) measured at the septal and lateral aspects of the mitral valve annulus in the 4-chamber view.
Two experienced board-certified echocardiographers (G.S.P. and V.M.F.) read all echocardiograms. To avoid interobserver variability, each parameter was measured by only 1 observer (G.S.P.: tenting height, tenting area, LV end-diastolic volume, LV end-systolic volume, left atrial dimension, and left atrial volume; V.M.F.: LV long axis, LV short axis, LV interpapillary muscle distance, E′, and systolic wave). Values for each measured parameter were obtained by averaging a minimum of 3 measurements for that parameter. Echocardiograms were read in a blinded manner without knowledge of OSA status.
Continuous variables are displayed as mean ± SD and categorical variables are displayed as number and percentage. Paired analyses were used to compare variables within groups over time. Nonparametric correlations (Spearman) were used to assess the relation between absolute changes (Δ) in echocardiographic variables over time in the 2 groups. Two-tailed p values <0.05 were considered statistically significant in advance. Linear regression was used to assess for univariate predictors of change in tenting height and tenting area; those variables with p values <0.10 were included in multivariate analysis. Multivariate linear regression was used to assess for predictors of change in tenting height and area after adjustment for variables identified in univariate analyses; p values <0.05 were considered statistically significant. Intraobserver variability was calculated for tenting height and tenting area and expressed as percentage. All analyses were performed using JMP 8.0 (SAS Institute, Cary, North Carolina).
Results
Fifty-four subjects were enrolled and followed for a mean of 240 days (range 180 to 431). Six patients did not have follow-up echocardiograms (11% of sample). Baseline characteristics of subjects included in the study are listed in Table 1 .
| Variable | OSA | p Value | |
|---|---|---|---|
| None/Mild (AHI <15) | Moderate/Severe (AHI ≥15) | ||
| (n = 14) | (n = 40) | ||
| Age (years) | 43 ± 13 | 45 ± 10 | 0.54 |
| Men | 3 (20%) | 18 (45%) | 0.12 ⁎ |
| African-American | 9 (64%) | 38 (94%) | |
| Hispanic | 2 (13%) | 1 (3%) | 0.011 ⁎ |
| Caucasian | 3 (20%) | 1 (3%) | |
| Diabetes mellitus | 2 (14%) | 10 (25%) | 0.48 ⁎ |
| Hypertension | 7 (50%) | 24 (60%) | 0.45 |
| Smokers | 2 (14%) | 14 (35%) | 0.17 ⁎ |
| Previous heart failure | 2 (14%) | 2 (5%) | 0.55 ⁎ |
| Chronic obstructive pulmonary disease | 0 | 3 (8%) | 0.54 ⁎ |
| Asthma | 3 (21%) | 11 (28%) | 0.73 ⁎ |
| Alcohol abuse | 3 (21%) | 15 (39%) | 0.32 ⁎ |
| Body mass index (kg/m 2 ) | 37 ± 6 | 42 ± 9 | 0.038 |
| Apnea hypopnea index (events/hour) | 4.9 ± 4 | 50 ± 28 | <0.0001 |
When divided into 2 groups, AHI <15 (mild/no OSA) and AHI ≥15 (moderate/severe OSA), baseline characteristics were similar between groups except for body mass index, which was higher in the group with moderate to severe OSA.
Intraobserver variability for the main outcome variables was 4% for tenting height and 6% for tenting area. Baseline Doppler echocardiographic variables for the 2 AHI groups are presented in Table 2 . Only lateral E′ differed significantly between groups (11.20 ± 2.4 cm/s in mild/no OSA vs 9.51 ± 2.9 cm/s in moderate/severe OSA, p = 0.05). Table 3 presents Doppler echocardiographic variables over time stratified by AHI groups. Of note, in those with moderate/severe OSA tenting height increased over time (1.17 ± 0.12 to 1.28 ± 0.17 cm, p = 0.001; Figure 2 ) as did tenting area (2.30 ± 0.41 to 2.66 ± 0.60 cm 2 , p = 0.0002; Figure 2 ). In the group with mild/no OSA there was no significant change in tenting height, whereas a borderline significant increase in tenting area (2.20 ± 0.44 to 2.31 ± 0.43 cm 2 , p = 0.05) was observed. Septal E′ decreased significantly from 8.04 ± 2.49 to 7.10 ± 1.83 cm/s in those with moderate/severe OSA, with no significant change noted in those with mild/no OSA.
| Variable | OSA | p Value | |
|---|---|---|---|
| None/Mild (AHI <15) | Moderate/Severe (AHI ≥15) | ||
| Left ventricular long axis | 7.91 ± 0.67 | 7.98 ± 0.77 | 0.77 |
| Left ventricular short axis | 4.59 ± 0.28 | 4.46 ± 0.62 | 0.31 |
| Left ventricular interpapillary muscle distance | 4.07 ± 0.45 | 3.89 ± 0.45 | 0.19 |
| Tenting height | 1.11 ± 0.16 | 1.17 ± 0.12 | 0.26 |
| Tenting area | 2.20 ± 0.44 | 2.30 ± 0.41 | 0.48 |
| Left atrial volume | 76.77 ± 27 | 70.45 ± 22 | 0.44 |
| End-diastolic volume | 97.19 ± 13.22 | 100.02 ± 30.43 | 0.63 |
| End-systolic volume | 43.82 ± 9.98 | 44.75 ± 19.28 | 0.81 |
| Ejection fraction (%) | 55.26 ± 6.4 | 56.36 ± 8.2 | 0.61 |
| Septal tissue Doppler early diastolic wave | 9.09 ± 1.95 | 8.04 ± 2.49 | 0.11 |
| Lateral tissue Doppler early diastolic wave | 11.20 ± 2.44 | 9.51 ± 2.92 | 0.05 |
| Septal tissue Doppler systolic wave | 7.80 ± 1.22 | 8.07 ± 1.64 | 0.52 |
| Lateral tissue Doppler systolic wave | 9.56 ± 1.89 | 8.50 ± 1.75 | 0.09 |
| Baseline | Follow-Up | p Value | |
|---|---|---|---|
| None/mild obstructive sleep apnea (apnea–hypopnea index <15) | |||
| Left ventricular long axis | 7.91 ± 0.67 | 7.99 ± 0.57 | 0.16 |
| Left ventricular short axis | 4.59 ± 0.28 | 4.57 ± 0.44 | 0.95 |
| Left ventricular interpapillary muscle distance | 4.07 ± 0.45 | 3.89 ± 0.44 | 0.23 |
| Tenting height | 1.11 ± 0.16 | 1.14 ± 0.14 | 0.09 |
| Tenting area | 2.20 ± 0.44 | 2.31 ± 0.43 | 0.05 |
| Left atrial volume | 76.77 ± 27 | 70.18 ± 17 | 0.30 |
| End-diastolic volume by modified Simpson method | 97.19 ± 13.2 | 93.64 ± 19.0 | 0.54 |
| End-systolic volume by modified Simpson method | 43.82 ± 10.0 | 42.71 ± 9.0 | 0.63 |
| Ejection fraction by modified Simpson method | 55.26 ± 6.4 | 56.22 ± 6.7 | 0.40 |
| Septal tissue Doppler early diastolic wave | 9.09 ± 1.95 | 7.92 ± 1.80 | 0.27 |
| Lateral tissue Doppler early diastolic wave | 11.20 ± 2.44 | 11.87 ± 3.45 | 0.31 |
| Septal tissue Doppler systolic wave | 7.80 ± 1.22 | 7.23 ± 1.32 | 0.08 |
| Lateral tissue Doppler systolic wave | 9.56 ± 1.89 | 8.61 ± 1.35 | 0.37 |
| Moderate/severe obstructive sleep apnea (apnea–hypopnea index >15) | |||
| Left ventricular long axis | 7.98 ± 0.77 | 8.22 ± 1.29 | 0.19 |
| Left ventricular short axis | 4.46 ± 0.62 | 4.35 ± 0.70 | 0.17 |
| Left ventricular interpapillary muscle distance | 3.89 ± 0.45 | 4.26 ± 1.25 | 0.07 |
| Tenting height | 1.17 ± 0.12 | 1.28 ± 0.17 | 0.001 |
| Tenting area | 2.30 ± 0.41 | 2.66 ± 0.60 | 0.0002 |
| Left atrial volume | 70.45 ± 22 | 67.16 ± 21 | 0.36 |
| End-diastolic volume by modified Simpson method | 100.02 ± 30.4 | 96.2 ± 28.8 | 0.25 |
| End-systolic volume by modified Simpson method | 44.75 ± 19.2 | 41.03 ± 15.6 | 0.12 |
| Ejection fraction by modified Simpson method | 56.36 ± 8.26 | 58.80 ± 6.0 | 0.10 |
| Septal tissue Doppler early diastolic wave | 8.04 ± 2.49 | 7.10 ± 1.83 | 0.005 |
| Lateral tissue Doppler early diastolic wave | 9.51 ± 2.92 | 9.63 ± 3.25 | 0.91 |
| Septal tissue Doppler systolic wave | 8.07 ± 1.64 | 7.83 ± 1.60 | 0.40 |
| Lateral tissue Doppler systolic wave | 8.50 ± 1.75 | 8.31 ± 1.77 | 0.72 |
Stay updated, free articles. Join our Telegram channel

Full access? Get Clinical Tree


