Renal dysfunction is an independent predictor of cardiovascular events and a negative prognostic indicator after myocardial infarction (MI). Randomized data comparing percutaneous coronary intervention to medical therapy in patients with MI with renal insufficiency are needed. The Occluded Artery Trial (OAT) compared optimal medical therapy alone to percutaneous coronary intervention with optimal medical therapy in 2,201 high-risk patients with occluded infarct arteries >24 hours after MI with serum creatinine levels ≤2.5 mg/dl. The primary end point was a composite of death, MI, and class IV heart failure (HF). Analyses were carried out using estimated glomerular filtration rate (eGFR) as a continuous variable and by eGFR categories. Long-term follow-up data (maximum 9 years) were used for this analysis. Lower eGFR was associated with development of the primary outcome (6-year life-table rates of 16.9% for eGFR >90 ml/min/1.73 m 2 , 19.2% for eGFR 60 to 89 ml/min/1.73 m 2 , and 34.9% for eGFR <60 ml/min/1.73 m 2 ; p <0.0001), death, and class IV HF, with no difference in rates of reinfarction. On multivariate analysis, eGFR was an independent predictor of death and HF. There was no effect of treatment assignment on the primary end point regardless of eGFR, and there was no significant interaction between eGFR and treatment assignment on any outcome. In conclusion, lower eGFR at enrollment was independently associated with death and HF in OAT participants. Despite this increased risk, the lack of benefit from percutaneous coronary intervention in the overall trial was also seen in patients with renal dysfunction and persistent occlusion of the infarct artery in the subacute phase after MI.
Many studies that have compared medical therapy to percutaneous coronary intervention (PCI) have either excluded patients with renal dysfunction or not commented on renal function. Data regarding the potential benefit of PCI in patients with coronary artery disease and chronic kidney disease (CKD) are limited, particularly after myocardial infarction (MI). Recent data have shown that these patients are often not treated with guideline-recommended therapies, including revascularization. The Occluded Artery Trial (OAT) was an international, randomized controlled trial comparing the use of PCI and optimal medical therapy (OMT) against OMT alone for patients with totally occluded infarct-related arteries >24 hours (calendar days 3 to 28) after MI. We analyzed outcomes and effects of randomized treatment in patients in OAT who had abnormal versus normal renal function at baseline. We hypothesized that patients with lower estimated glomerular filtration rates (eGFRs) would have higher rates of the primary outcome and, given that higher risk, might derive more benefit from revascularization compared to those with normal renal function.
Methods
The full methods and results of OAT have been published elsewhere. Briefly, OAT included patients with persistent occlusion of the infarct-related artery >24 hours after symptom onset, who were stable and at high risk on the basis of future event rates, defined by ejection fraction <50% and/or proximal occlusion of a major epicardial vessel. Participants were randomized to receive PCI plus OMT (the PCI group) or OMT alone. Relevant exclusion criteria included serum creatinine >2.5 mg/dl (221 μmol/L), New York Heart Association class III or IV heart failure (HF), shock, left main or 3-vessel coronary disease, and severe ischemia on stress testing. Patients were to receive OMT, including aspirin, angiotensin-converting enzyme inhibitors or angiotensin receptor blockers, β blockers, lipid-lowering medications unless contraindicated, and anticoagulation if indicated. Thienopyridine therapy was initiated before PCI and continued for 2 to 4 weeks until 2003, at which time the treatment was recommended for ≥1 year. PCI technical success was defined centrally as <50% residual in-segment stenosis. The primary end point was a composite of death, reinfarction, and hospitalization for New York Heart Association class IV HF. Secondary end points included the components of the primary end point, hospitalization for any class of HF, and cardiovascular death. Data presented here include long-term follow-up of the OAT cohort and assessment of reinfarction according to the universal definition of MI.
The 4-component (simplified) Modification of Diet in Renal Disease (MDRD) study equation was used to calculate eGFR. This estimate of glomerular filtration rate has been shown to provide superior prognostic information to the Cockcroft-Gault formula in patients with chest pain syndromes. The creatinine level used in this analysis was the prerandomization value. The National Kidney Foundation CKD stages were used to divide the patients into normal renal function (eGFR >90 ml/min/1.73 m 2 ), mild renal dysfunction (eGFR 60 to 89 ml/min/1.73 m 2 ), and moderate renal dysfunction (eGFR <60 ml/min/1.73 m 2 ). It was anticipated that very few patients enrolled in OAT have eGFRs <30 ml/min/1.73 m 2 on the basis of the creatinine exclusion criterion. All deaths were categorized by an independent morbidity and mortality classification committee, which was blinded to treatment assignment, with reporting of the primary and immediate causes using standardized definitions. Death from cancer was a subset of noncardiovascular death.
Baseline demographic differences among the 3 groups were analyzed using a 1-way analysis of variance for continuous variables and chi-square analysis for categorical variables. The effects of eGFR on outcomes were assessed modeling eGFR as a continuous variable and categorizing renal function by eGFR category. The analyses of eGFR as a continuous variable predicting outcomes data were performed using a Cox regression analysis, with calculation of hazard ratios for PCI versus OMT. Separating the participants into eGFR categories, estimates of cumulative 6-year event rates were calculated using the Kaplan-Meier product-limit method. Hazard ratios were calculated using Cox regression analysis. Because the eGFR groups differ in many baseline characteristics, and several of these have been shown to affect outcomes for the OAT population, we generated covariate-adjusted hazard ratios using a Cox proportional-hazards regression model with the covariates of interest. The covariates were significantly associated with the primary outcome in OAT (the left ventricular ejection fraction, time to randomization, diabetes, peripheral vascular disease, previous HF, and rales on examination at the time of randomization). All analyses were by intention to treat. The predetermined significant p value for all post hoc analyses in OAT is <0.01, with p values <0.05 labeled as indicating a strong trend toward statistical significance.
Results
Baseline serum creatinine was available for 2,160 of the 2,201 OAT participants (98.1%), of whom 624 (28.9%) had normal renal function (eGFR >90 ml/min/1.73 m 2 ), 1,216 (56.3%) had mild renal dysfunction (eGFR 60 to 90 ml/min/1.73 m 2 ), and 320 (14.8%) had moderate renal dysfunction (eGFR <60 ml/min/1.73 m 2 ). Baseline clinical and angiographic variables by eGFR category are listed in Table 1 . As expected, there was a small number (n = 8) of patients categorized as having stage 4 CKD (eGFR <30 ml/min/1.73 m 2 ). The average follow-up duration was 5.6 years (SE 17 days, no difference between the PCI and OMT-only groups). Patients with more severe renal impairment were older, more likely to be women, and more likely to have histories of diabetes, hypertension, HF, and cerebrovascular disease. On presentation, participants with lower eGFRs were more likely to have rales. There was a strong trend toward more multivessel disease in patients with lower eGFRs. PCI technical success rates were similar in all eGFR groups, but there was a strong trend toward a higher frequency of post-PCI Thrombolysis In Myocardial Infarction (TIMI) flow grade 0 or 1 in patients with lower eGFR. The treatment groups were balanced for baseline and angiographic characteristics for all eGFR categories. Discharge medications are listed in Table 1 . There was no difference in thienopyridine (clopidogrel or ticlopidine) use among the 3 eGFR categories. Patients assigned to PCI were more likely to be discharged on thienopyridines in all eGFR categories.
| Variable | eGFR >90 ml/min/1.73 m 2 | eGFR 60–90 ml/min/1.73 m 2 | eGFR <60 ml/min/1.73 m 2 | p Value ⁎ |
|---|---|---|---|---|
| (n = 624 [28.9%]) | (n = 1,216 [56.3%]) | (n = 320 [14.8%]) | ||
| Assigned to PCI | 316 (50.6%) | 591 (48.6%) | 169 (52.8%) | 0.77 |
| eGFR (ml/min/1.73 m 2 ) | 106 ± 16.6 | 75.5 ± 8.1 | 50.4 ± 7.7 | NA |
| Age (years) | 54.2 ± 9.7 | 58.7 ± 10.5 | 67.2 ± 9.6 | <0.0001 |
| Men | 533 (85.4%) | 969 (79.7%) | 181 (56.6%) | <0.0001 |
| White | 492 (78.8%) | 983 (80.8%) | 257 (80.3%) | 0.60 |
| Diabetes mellitus | 127 (20.4%) | 222 (18.3%) | 96 (30%) | 0.009 |
| Previous MI | 59 (9.5%) | 149 (12.3%) | 35 (10.9%) | 0.28 |
| Hypertension | 245 (39.3%) | 589 (48.4%) | 221 (69.1%) | <0.0001 |
| HF | 7 (1.1%) | 27 (2.2%) | 18 (5.6%) | <0.0001 |
| Cerebrovascular disease | 11 (1.8%) | 50 (4.1%) | 20 (6.3%) | 0.0003 |
| Peripheral vascular disease | 26 (4.2%) | 37 (3%) | 16 (5%) | 0.84 |
| Previous PCI | 26 (4.2%) | 56 (4.6%) | 19 (5.9%) | 0.26 |
| Hyperlipidemia † | 316 (50.6%) | 629 (51.7%) | 177 (55.5%) | 0.19 |
| Family history of coronary artery disease | 266 (42.6%) | 496 (40.8%) | 105 (32.8%) | 0.008 |
| Cigarette smoker | 324 (51.9%) | 449 (36.9%) | 72 (22.5%) | <0.0001 |
| Body mass index (kg/m 2 ) | 28.4 ± 5.1 | 28.6 ± 4.9 | 28.5 ± 5.3 | 0.77 |
| At randomization | ||||
| Rales on examination | 25 (4%) | 69 (5.7%) | 40 (12.5%) | <0.0001 |
| New York Heart Association class II–IV | 107 (17.1%) | 249 (20.5%) | 93 (29.1%) | <0.0001 |
| Thrombolytic in first 24 hours | 103 (16.5%) | 245 (20.2%) | 65 (20.3%) | 0.09 |
| Heart rate (beats/min) | 72.1 ± 11.5 | 71.4 ± 11.9 | 72.7 ± 12.7 | 0.13 |
| Systolic blood pressure (mm Hg) | 119.4 ± 17.4 | 120.7 ± 17.7 | 123.9 ± 19.7 | 0.001 |
| Diastolic blood pressure (mm Hg) | 72.6 ± 11.1 | 72.3 ± 11.4 | 71.8 ± 11.6 | 0.63 |
| Heart rate | 72.1 ± 11.5 | 71.4 ± 11.9 | 72.7 ± 12.7 | 0.13 |
| Blood glucose (mg/dl) | 122.8 ± 47.2 | 116.5 ± 36.8 | 126.9 ± 48.4 | 0.0001 |
| Time to randomization (days) ‡ | 10.1 ± 7.4 | 11.2 ± 7.8 | 11.6 ± 7.6 | 0.004 |
| Infarct-related coronary artery | 0.06 | |||
| Left anterior descending | 205 (32.9%) | 448 (36.8%) | 123 (38.4%) | |
| Left circumflex | 113 (18.1%) | 169 (13.9%) | 48 (15%) | |
| Right | 306 (49%) | 599 (49.3%) | 149 (46.6%) | |
| Collateral circulation § | 552 (89.2%) | 1,065 (88.5%) | 273 (86.7%) | 0.29 |
| Multivessel disease | 96 (15.5%) | 209 (17.3%) | 69 (21.6%) | 0.03 |
| Left ventricular ejection fraction (%) | 48.2 ± 10 | 47.9 ± 11.3 | 46.2 ± 12.1 | 0.02 |
| Mitral regurgitation grade | 0.002 | |||
| 0 | 351 (69%) | 655 (66%) | 145 (56.9%) | |
| 1–3 | 158 (71%) | 337 (34%) | 110 (43.1%) | |
| Successful PCI ∥ | 271 (88.6%) | 543 (87.7%) | 123 (83.1%) | 0.24 |
| Post-PCI TIMI flow grade | 0.03 | |||
| 0 or 1 (closed) | 29 (9.6%) | 76 (12.4%) | 27 (18.4%) | |
| 2 or 3 (open) | 273 (90.4%) | 537 (87.6%) | 120 (81.6%) | |
| Discharge medications | ||||
| Aspirin | 605 (97%) | 1,166 (95.9%) | 296 (92.5%) | 0.005 |
| Clopidogrel ¶ | 319 (51.1%) | 591 (48.6%) | 154 (48.1%) | 0.54 |
| Lipid-lowering agents | 533 (85.4%) | 994 (81.7%) | 235 (73.4%) | <0.0001 |
| Insulin | 43 (6.9%) | 59 (4.9%) | 35 (10.9%) | 0.0003 |
| Antiarrhythmic agents (other than β blockers) | 14 (2.2%) | 45 (3.7%) | 25 (7.8%) | 0.0001 |
| Digoxin | 12 (1.9%) | 28 (2.3%) | 19 (5.9%) | 0.0006 |
| Diuretics | 74 (11.9%) | 182 (15%) | 107 (33.4%) | <0.0001 |
⁎ For differences among the 3 eGFR categories.
† Previous diagnosis of hyperlipidemia, history of treatment with lipid-lowering medication, or fasting low-density lipoprotein ≥130 mg/dl.
‡ Time to randomization was the interval between MI and randomization.
§ Angiographically visible collateral vessels.
∥ Successful PCI was defined as <50% residual stenosis with TIMI grade 2 or 3 flow (note that 65 patients with excellent technical results but poor reflow were categorized as having successful PCI).
¶ No significant differences existed between the OMT-only and PCI groups in all eGFR groups, except for the use of clopidogrel (more likely in the PCI group across all 3 eGFR categories, p <0.05).
When examined as a continuous function, lower eGFR was associated with higher primary end point composite event rates and with death, class IV HF, and cardiovascular death ( Table 2 ). There was no relation between eGFR and reinfarction. On multivariate analysis, eGFR remained a significant predictor of all-cause mortality and class IV HF. The relation between eGFR and cardiovascular death was not significant in the multivariate analysis.
| Variable | eGFR (ml/min/1.73 m 2 ) | ||||||||
|---|---|---|---|---|---|---|---|---|---|
| ≥90 (n = 624) | 60–89 (n = 1,216) | <60 (n = 320) | HR per 10-Unit Decrease in eGFR (99% CI) | p Value | Adjusted p Value ⁎ | ||||
| n | Estimated 6-Year Rate (%) | n | Estimated 6-Year Rate (%) | n | Estimated 6-Year Rate (%) | ||||
| Primary end point | 93 | 16.9 | 211 | 19.2 | 102 | 34.9 | 1.15 (1.07–1.22) | <0.0001 | 0.0001 |
| All-cause death | 56 | 10.2 | 135 | 12.4 | 75 | 26.0 | 1.21 (1.11–1.31) | <0.0001 | <0.0001 |
| Reinfarction | 36 | 6.7 | 74 | 6.9 | 23 | 8.9 | 1.03 (0.92–1.14) | 0.52 | 0.83 |
| Class IV HF | 19 | 3.3 | 45 | 4.1 | 36 | 12.4 | 1.29 (1.12–1.48) | <0.0001 | 0.0008 |
| Class III or IV HF | 33 | 5.9 | 68 | 6.1 | 42 | 14.5 | 1.17 (1.05–1.31) | 0.0003 | 0.02 |
| Any class HF | 41 | 7.4 | 85 | 7.8 | 52 | 17.9 | 1.20 (1.09–1.33) | <0.0001 | 0.0019 |
| Cardiovascular death | 36 | 6.5 | 75 | 6.7 | 36 | 12.6 | 1.14 (1.03–1.27) | 0.002 | 0.09 |
| Noncardiovascular death † | 15 | 2.9 | 46 | 4.5 | 34 | 13.1 | 1.30 (1.13–1.50) | <0.0001 | <0.0001 |
| Death from cancer | 5 | 1.1 | 19 | 1.9 | 14 | 5.8 | 1.34 (1.06–1.67) | 0.001 | 0.004 |
⁎ With covariates of left ventricular ejection fraction, time to randomization, rales on examination, and history of diabetes, peripheral vascular disease, or heart failure.
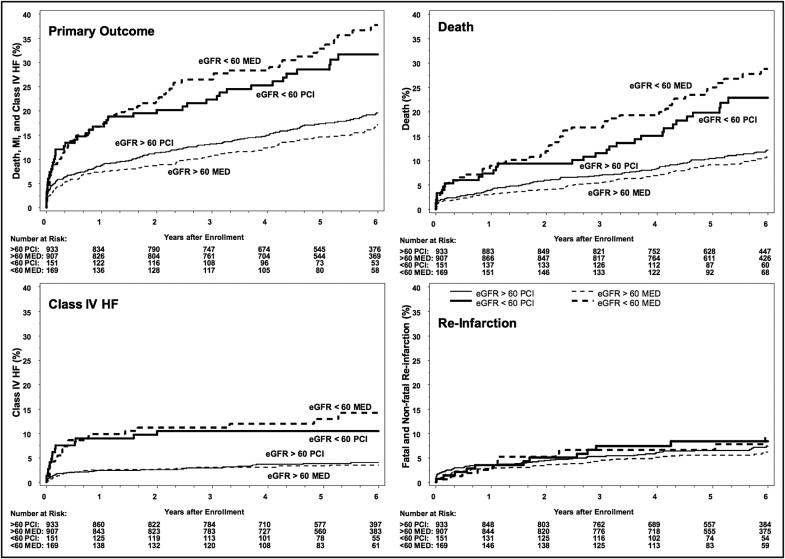
Kaplan-Meier survival curves for primary and secondary outcomes divided by eGFR categories are depicted in Figure 1 . The group with poorest renal function (eGFR <60 ml/min/1.73 m 2 ) had a higher risk for the primary end point compared to patients with higher eGFRs (hazard ratio [HR] 2.15, 99% confidence interval [CI] 1.60 to 2.89, p <0.0001). Patients with eGFRs <60 ml/min/1.73 m 2 also had higher rates of death (HR 2.47, 99% CI 1.74 to 3.51, p <0.0001), class IV HF (HR 3.53, 99% CI 2.06 to 6.03, p <0.001), and cardiovascular death (HR 2.00, 99% CI 1.22 to 3.27, p = 0.0003). In the multivariate analysis, patients with eGFRs <60 ml/min/1.73 m 2 had significantly higher rates of the primary outcome (HR 1.79, 99% CI 1.32 to 2.43, adjusted p <0.0001), death (HR 2.01, 99% CI 1.40 to 2.89, adjusted p <0.0001), and class IV HF (HR 2.68, 99% CI 1.54 to 4.67, adjusted p <0.0001), while cardiovascular death showed a trend toward significance (HR 1.55, 99% CI 0.93 to 2.57, adjusted p = 0.03). The group with moderate renal dysfunction had similar rates of reinfarction to those with eGFRs >60 ml/min/1.73 m 2 (HR 1.28, 99% CI 0.71 to 2.32, p = 0.28).
Lower eGFR was associated with a higher rate of noncardiovascular death, including a higher rate of death from malignancy ( Table 2 ). The difference was due to increased risk in patients with the poorest renal function (eGFR <60 ml/min/1.73 m 2 ), who had more noncardiovascular death (HR 3.57, 99% CI 2.06 to 6.19, adjusted p <0.0001) and death from malignancy (HR 3.75, 99% CI 1.58 to 8.92, adjusted p = 0.0002) compared to those with eGFRs >60 ml/min/1.73 m 2 .
There were no significant differences in primary or secondary end point rates between the PCI group and the OMT-only group for any eGFR category ( Table 3 ). There was no significant interaction between eGFR category and treatment assignment for the primary outcome (p = 0.18) or any secondary outcome (death p = 0.06, reinfarction p = 0.99, class IV HF p = 0.83). As in the trial overall, reinfarction events were mostly of the spontaneous type. There was no difference in the distribution of type of reinfarction on the basis of eGFR categories (data not shown). In particular, type 3 reinfarction (sudden death) was equally common in participants with normal eGFRs, mild or moderate renal dysfunction (6-year rate 0.5% vs 0.7% vs 0.3%, respectively).


