Total plasma homocysteine (tHcy) is an independent risk factor for coronary artery disease, and tHcy is lowered by B vitamins. To assess the effect of homocysteine-lowering B-vitamin treatment on angiographic progression of coronary artery disease, this substudy of the Western Norway B Vitamin Intervention Trial (WENBIT) included patients who had undergone percutaneous coronary intervention. The patients were randomized to daily oral treatment with folic acid, vitamin B 12 , and vitamin B 6 or placebo in a 2 × 2 factorial design. The coronary angiograms obtained at baseline and follow-up were evaluated. The primary angiographic end points were the changes in minimum lumen diameter and diameter stenosis. A total of 348 subjects (288 men) with a mean ± SD age of 60 ± 10.2 years were followed up for a median of 10.5 months (twenty-fifth, seventy-fifth percentile 9.2, 11.8). The baseline median plasma tHcy level was 10.0 μmol/L (twenty-fifth, seventy-fifth percentile 8.1, 11.0), and treatment with folic acid/vitamin B 12 lowered the tHcy levels by 22%. At follow-up, we found 309 lesions with a significant decrease from baseline in the minimum lumen diameter of a mean of −0.16 ± 0.4 mm and an increase in the diameter stenosis of 4.4 ± 0.7%. Treatment with folic acid/vitamin B 12 or vitamin B 6 was not associated with a change in diameter stenosis or minimum lumen diameter. In a post hoc analysis, folic acid/vitamin B 12 treatment was significantly associated with rapid progression (odds ratio 1.84, 95% confidence interval 1.07 to 3.18). In conclusion, vitamin B treatment showed no beneficial effect on the angiographic progression of coronary artery disease, and the post hoc analyses suggested that folic acid/vitamin B 12 treatment might promote more rapid progression.
Hyperhomocysteinemia has been associated with cardiovascular disease in prospective studies. The potential adverse effects of hyperhomocysteinemia have been explained by several mechanisms, including increased thrombogenicity and increased systemic inflammation. Most large randomized clinical trials have, however, demonstrated no beneficial effect from homocysteine-lowering with B vitamins on cardiovascular outcomes, including 2 trials conducted in Norway. Major adverse cardiovascular events have recently been attributed to coronary plaque rupture and atherothrombosis involving inflammatory processes that might not directly be related to the size and morphology of the coronary lesion. These processes are not necessarily propagated by the same pathomechanisms explaining the progression of stable coronary artery disease (CAD). It has been suggested that elevated homocysteine in patients at risk of cardiovascular disease is primarily correlated with underlying vascular inflammation. Previous studies have shown promising results on atherosclerotic plaque progression using homocysteine-lowering B-vitamin treatment. The objective of the present investigation was to determine whether such treatment had any effect on the progression of CAD as measured by sensitive angiographic methods in patients who had undergone coronary angiography for suspected CAD and residing in a country without folic acid fortification of foods and with a modest use of over-the-counter B-vitamin supplements.
Methods
The subjects included in the present study participated in the Western Norway B Vitamin Intervention Trial (WENBIT), a double-blinded, placebo-controlled, 2-center trial that included 3,090 adult patients (20.5% women) who had undergone coronary angiography for suspected CAD. The details and the main results of the trial have been previously described. To simultaneously evaluate the effect of folic acid/vitamin B 12 and vitamin B 6 , the patients were randomly assigned to 1 of 4 groups, using a 2 × 2 factorial design, to daily receive an oral capsule with one of the following compositions: (1) folic acid 0.8 mg plus vitamin B 12 (cyanocobalamin) 0.4 mg, and vitamin B 6 (pyridoxine) 40 mg; (2) folic acid plus vitamin B 12 ; (3) vitamin B 6 ; or (4) placebo.
Of the 3,090 WENBIT participants, 1,359 (44%) underwent percutaneous coronary intervention (PCI) after the baseline angiogram. Of these 1,359 patients, 465 (34%) were treated at Stavanger University Hospital and 894 (66%) at Haukeland University Hospital. The patients eligible for the present substudy were recruited from the Haukeland University Hospital, which is a primary, secondary, and tertiary referral hospital, from October 2001 to May 2004 (n = 570). The patients asked to participate largely constituted the primary referral population. The follow-up repeat angiogram was either scheduled to occur approximately 10 months after the initial PCI (to coincide with the 1-year WENBIT control group), or it was performed for clinical indications ≥90 days after the PCI. The patients scheduled for repeat angiography who were rehospitalized for clinical indications within 90 days after the initial PCI were excluded to rule out PCI-related complications (n = 13).
The general WENBIT exclusion criteria were an inability or reluctance to attend long-term follow-up, alcohol abuse, mental illness, and known active malignant disease. For the current substudy, patients at high risk of procedural complications or who presented with a baseline coronary anatomy of such a nature that repeat angiography would probably prove unsuccessful were also excluded. Additional exclusion criteria were baseline and/or follow-up coronary angiograms considered unsuitable for quantitative analysis.
All WENBIT participants provided written informed consent, and the patients scheduled for repeat angiography provided additional written informed consent. The Regional Committee for Medical and Health Research Ethics, the Norwegian Medicines Agency, and the Data Inspectorate approved the WENBIT. The Regional Ethics Committee approved the protocol for the present substudy. The ClinicalTrials.gov identifier was NCT00354081 .
The baseline and follow-up coronary angiograms were analyzed using quantitative coronary angiography (QCA) by 2 trained technicians, who were unaware of the treatment regimen and who were supervised by an experienced interventional cardiologist. A total of 16 coronary artery segments were evaluated in all patients (i.e., 15 segments according to the American Heart Association standardization criteria plus the right atrioventricular branch). Eligible lesions for analysis had a reference diameter of ≥2 mm, a diameter reduction of ≥30% at baseline or follow-up, and were adequately visualized at similar projections on both angiograms. The analyzed segment had not been treated with PCI. Cases of disagreement between the observers about the eligibility of a certain lesion were subject to reanalysis by both observers. After all QCA procedures, segments from both observers were compared to ensure equality concerning the accurate numbering of the segments, the correct angiogram analyzed, and the actual stenosis portrayed.
The lesions were analyzed using digitalized QCA (Quantcor QCA, CAAS II, version 5.0, Pie Medical Imaging, Maastricht, The Netherlands). An end-diastolic frame showing the stenosis without foreshortening or vessel overlap and free of intracoronary wires was selected. If the stenosis differed in severity on different projections, the projection demonstrating the most severe stenosis was subject to analysis.
The contrast-filled tip of the catheter was used for calibration, and computer-defined obstruction analysis without manual contour correction was used, where applicable. However, ostial stenoses required the use of manually defined obstruction analysis (user-defined reference vessel diameter and stenosis length), and branched artery segment required manual correction of vessel contour.
The primary measures for each selected lesion were the minimum lumen diameter (MLD) and diameter stenosis (DS). Both parameters were measured as continuous variables, defined as the mean of the values measured separately by each observer.
When all baseline and follow-up lesions had been analyzed by both observers, the interobserver difference in DS was calculated. The 10% of lesions with the largest difference were subject to reanalysis. DS was chosen as the appropriate variable to assess, because it, in contrast to MLD, is a relative measurement, thus reducing any potential calibration errors between the baseline and follow-up angiograms.
The primary angiographic end points of the study were defined as the change in MLD and DS from baseline to follow-up. Additionally, we defined a post hoc secondary end point of rapidly progressing lesions as the 25% of all analyzed lesions with the greatest diameter reduction expressed by DS.
Blood samples were collected at baseline and follow-up before repeat angiography. Routine blood analyses, such as hematologic parameters, renal function markers, and lipid-related factors, were analyzed in fresh samples at the Laboratory of Clinical Biochemistry, Haukeland University Hospital, using standard methods. Blood samples for the measurements of total plasma homocysteine (tHcy) and B vitamins were analyzed at the laboratory of Bevital AS, Bergen, Norway, using previously described methods.
The analyses were conducted according to the intention-to-treat principle. Continuous variables are reported as the mean ± SD or median (twenty-fifth, seventy-fifth percentile), as appropriate. Categorical variables are presented as numbers (percentages).
Interobserver reliability was assessed on the QCA measurements by calculating the average measure intraclass coefficient. Differences between subgroups in the continuous variables were analyzed using Student’s t test or the Mann-Whitney U test. Differences in categorical variables were analyzed using the chi-square test or Fisher’s exact test. For these analyses, we used the Statistical Packages for the Social Sciences, version 15.0.1 (SPSS, Chicago, Illinois).
To assess the change over time and the treatment effect on each coronary artery segment on the primary end points, we used a linear mixed effects model fitted by restricted maximum likelihood. The response variable was DS or MLD measured at follow-up, fitted against the follow-up interval in days. The fixed effects were the baseline DS or MLD measurements, folic acid/vitamin B 12 versus no folic acid/vitamin B 12 treatment, and vitamin B 6 versus no vitamin B 6 treatment. The mixed effects model included a random effect term adjusting for the within-patient clustering of coronary artery segments. The models were fit using the nlme package, version 3.1-85 as implemented in the R statistical software, version 2.6.0-2.9.0 (R Development Core Team, Vienna, Austria). Figures were made using the R package ggplot2 , version 0.8.3.
To assess the treatment effect on rapid progressing lesions as a binary response variable, we used a generalized linear model for dependent data with the gee package, version 4.13-13, adjusting for the hierarchical structure of the data.
For all analyses, a p value of <0.05 was considered statistically significant, and the reported p values were not adjusted for multiple comparisons.
Results
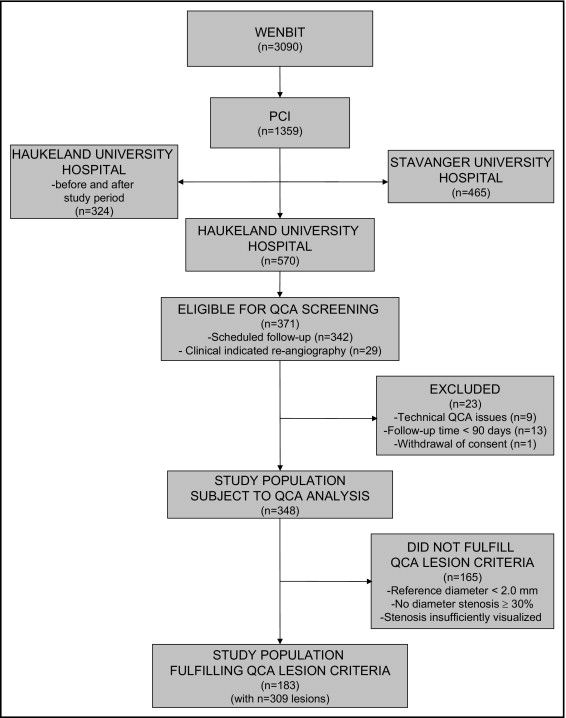
Figure 1 shows the numbers of patients eligible for and included in the present study. Of the 570 WENBIT participants who underwent PCI after baseline coronary angiography at Haukeland University Hospital, 371 (65%) underwent repeat angiography. Of these, 342 patients (92%) underwent scheduled repeat angiography and 29 (8%) had a clinical indication for repeat angiography. A total of 23 participants (6%) were excluded from the analysis because of inadequate angiograms. Of the remaining 348 participants (94%) with adequate serial QCA data, 183 (53%) had at least one qualifying lesion, for a total of 309 lesions for analysis.
No statistically significant differences were found across the 4 treatment groups in the baseline demographic, clinical, or laboratory characteristics ( Table 1 ). The mean age was 60.0 ± 10.2 years, 17.2% were women, and 31.3% of the patients had a history of myocardial infarction. The median serum total cholesterol level was 185.3 mg/dl (twenty-fifth, seventy-fifth percentile 162.2, 216.2), serum triglyceride level was 134.5 mg/dl (twenty-fifth, seventy-fifth percentile 98.2, 195.6), and serum C-reactive protein was 1.91 mg/L (twenty-fifth, seventy-fifth percentile 0.87, 5.14). Of the 348 participants, >96% were receiving statin treatment. No difference was found among the groups regarding the type of statin or dosage (data not shown). The median plasma tHcy level was 10.0 μmol/L (twenty-fifth, seventy-fifth percentile 8.1, 11.0), serum folate was 10.6 nmol/L (twenty-fifth, seventy-fifth percentile 7.7, 14.2), and 24 of the participants (6.9%) had hyperhomocysteinemia ≥15.0 μmol/L.
| Variable | Folic Acid/Vitamin B 12 and Vitamin B 6 (n = 91) | Folic Acid/Vitamin B 12 (n = 87) | Vitamin B 6 (n = 87) | Placebo (n = 83) | p Value |
|---|---|---|---|---|---|
| Age (years) | 59.2 ± 10.9 | 60.3 ± 10.6 | 59.7 ± 9.1 | 60.8 ± 10.1 | 0.76 |
| Women | 14 (15.4%) | 16 (18.4%) | 16 (18.4%) | 14 (16.9%) | 0.94 |
| Systolic blood pressure (mm Hg) | 138 ± 20 | 138 ± 19 | 142 ± 26 | 144 ± 25 | 0.19 |
| Body mass index (m 2 /kg) | 27.1 ± 3.4 | 26.7 ± 3.3 | 26.8 ± 2.9 | 27.4 ± 3.8 | 0.46 |
| Ejection fraction ⁎ (%) | 62.1 ± 8.7 | 64.0 ± 8.2 | 64.1 ± 8.1 | 65.1 ± 10.0 | 0.15 |
| Stable angina pectoris | 66 (72.5%) | 67 (77.0%) | 61 (70.1%) | 63 (75.9%) | 0.72 |
| NSTEACS | 25 (27.5%) | 20 (23.0%) | 26 (29.9%) | 20 (24.1%) | 0.72 |
| Cardiovascular risk factors | |||||
| Extracardial vascular disease † | 6 (6.6%) | 10 (11.5%) | 16 (18.4%) | 9 (10.8%) | 0.11 |
| Previous acute myocardial infarction | 25 (27.5%) | 29 (33.3%) | 31 (35.6%) | 24 (28.9%) | 0.62 |
| Previous percutaneous coronary intervention | 17 (18.7%) | 19 (21.8%) | 17 (19.5%) | 13 (15.7%) | 0.78 |
| Previous coronary bypass | 6 (6.6%) | 2 (2.3%) | 2 (2.3%) | 3 (3.6%) | 0.47 |
| Hypercholesterolemia ‡ | 47 (51.6%) | 51 (58.6%) | 48 (55.2%) | 52 (62.7%) | 0.50 |
| Hypertension § | 36 (39.6%) | 36 (41.4%) | 35 (40.2%) | 37 (44.6%) | 0.91 |
| Diabetes mellitus ¶ | 6 (6.6%) | 9 (10.3%) | 9 (10.3%) | 9 (10.8%) | 0.75 |
| Current smoker | 29 (31.9%) | 26 (29.9%) | 28 (32.2%) | 22 (26.5%) | 0.84 |
| Extent of coronary artery disease | |||||
| One-vessel disease | 46 (50.5%) | 44 (50.6%) | 43 (49.4%) | 41 (49.4%) | 1.00 |
| Two-vessel disease | 32 (35.2%) | 27 (31.0%) | 32 (36.8%) | 32 (38.6%) | 0.76 |
| Three-vessel disease | 13 (14.3%) | 16 (18.4%) | 12 (13.8%) | 10 (12.0%) | 0.69 |
| Medications | |||||
| Statins | 91 (100%) | 86 (98.9%) | 84 (96.6%) | 80 (96.4%) | 0.22 |
| β-Adrenergic receptor antagonists | 68 (74.7%) | 74 (85.1%) | 62 (71.3%) | 62 (74.7%) | 0.16 |
| Calcium antagonists | 14 (15.4%) | 14 (16.1%) | 18 (20.7%) | 10 (12.0%) | 0.49 |
| Angiotensin-converting enzyme inhibitors or angiotensin receptor blockers | 14 (15.4%) | 14 (16.1%) | 16 (18.4%) | 15 (18.1%) | 0.94 |
| Acetylsalicylic acid | 88 (96.7%) | 86 (98.9%) | 86 (98.9%) | 83 (100%) | 0.41 |
| Adenosine 5′-diphosphate receptor antagonists | 86 (94.5%) | 81 (93.1%) | 80 (92.0%) | 79 (95.2%) | 0.82 |
| C-reactive protein (mg/L) | 1.58 (0.82, 5.32) | 2.01 (0.88, 4.91) | 1.84 (0.99, 5.05) | 2.16 (0.90, 5.53) | 0.93 |
| Low-density lipoprotein cholesterol (mg/dl) ∥ | 108.3 (92.8, 131.5) | 116.0 (92.8, 143.1) | 108.3 (92.8, 131.5) | 123.7 (100.5, 146.9) | 0.25 |
| High-density lipoprotein cholesterol (mg/dl) ∥ | 46.4 (38.7, 54.1) | 46.4 (38.7, 54.1) | 46.4 (38.7, 54.1) | 46.4 (38.7, 58.0) | 0.97 |
| Serum creatinine (μmol/L) | 86 (81, 95) | 87 (82, 95) | 91 (82, 99) | 89 (82, 97) | 0.46 |
| Serum glucose (mmol/L) | 5.8 (5.2, 6.8) | 5.5 (5.0, 6.5) | 5.6 (4.8, 6.6) | 5.4 (5.0, 6.5) | 0.63 |
| Total plasma homocysteine (μmol/L) | 9.79 (7.96, 11.75) | 9.94 (8.72, 11.53) | 9.22 (7.42, 11.21) | 9.85 (7.73, 11.20) | 0.13 |
| Serum folate (nmol/L) | 9.84 (7.52, 13.62) | 9.78 (7.16, 14.7) | 10.63 (7.30, 15.23) | 10.56 (7.70, 10.56) | 0.72 |
⁎ Measured during ventriculography for most patients; when this was not performed, ultrasound echocardiography was used.
† Previous diagnosis of any peripheral or cerebrovascular disease.
‡ Defined as history of untreated total serum cholesterol ≥251.4 mg/dl (6.5 mmol/L) or familial hypercholesterolemia.
§ Defined as systolic blood pressure >140 mm Hg and/or diastolic pressure >90 mm Hg and/or antihypertensive therapy.
¶ Including diabetes mellitus types 1 and 2.
∥ To convert milligrams per deciliter to millimoles per liter multiply by 0.02586.
The patients were followed up for a median of 10.5 months (twenty-fifth, seventy-fifth percentile 9.2, 11.8). Many patients started statin therapy at baseline, and we observed a statistically significant reduction in serum apolipoprotein B-100 (median −0.06 mmol/L; twenty-fifth, seventy-fifth percentile −0.21, 0.04) during the follow-up period, irrespective of vitamin B treatment. Patients assigned to folic acid/vitamin B 12 had decreased tHcy levels by 22% (−2.15 ± 0.42 μmol/L, p <0.0001). However, the patients receiving vitamin B 6 alone or placebo had unchanged tHcy levels at follow-up.
A total of 309 lesions from 183 patients were finally identified by both observers that complied with the criteria for analysis of MLD and DS and were included in the analysis results listed in Table 2 . Approximately 1/2 of the included lesions were located in the right coronary artery, and the rest were essentially evenly distributed between the left anterior descending and circumflex coronary arteries.
Stay updated, free articles. Join our Telegram channel

Full access? Get Clinical Tree


