Microembolization during percutaneous coronary intervention (PCI) causes minor myocardial injury, and a Doppler guidewire can detect embolic particles as high-intensity transient signals (HITS). The present study investigated the effect of microembolization during PCI on regional wall motion using a Doppler guidewire and myocardial strain analysis. We performed PCI to the left anterior descending coronary artery in 25 patients (18 men and 7 women, 68 ± 8 years old) with stable angina pectoris. Coronary flow spectrums were obtained with a Doppler guidewire to count the total number of HITS throughout the PCI procedures. On the days before and after PCI, we recorded echocardiography and measured the longitudinal peak systolic strain, peak strain rate, and early diastolic strain rate in the left anterior descending territory using a 2-dimensional speckle tracking method. PCI was successfully performed, and 10 ± 6 HITS (range 0 to 22, median 9) were recognized during PCI. The echocardiographic study showed no visible wall motion abnormalities in the left anterior descending territory either after or before PCI. In cases in which the total number of HITS was ≥10, the peak systolic strain, peak strain rate, and early diastolic strain rate worsened on the day after PCI compared with those on the day before PCI (p <0.01). The rates of change in peak systolic strain and early diastolic strain rate, defined as the ratios of those parameters after PCI to those before PCI, had modest to strong inverse correlations with the total number of HITS (R 2 = 0.35 and R 2 = 0.46, respectively). In conclusion, periprocedural microembolization during PCI reduces subclinical cardiac function in patients with stable angina pectoris.
Recent progress in echocardiography has made it possible to identify subclinical changes in regional wall motion and to diagnose myocardial ischemia using strain analysis. Coronary occlusion during percutaneous coronary intervention (PCI) induces transient myocardial ischemia, which results in a marked reduction in the systolic strain in both radial and longitudinal directions. Ishii et al reported that the transverse diastolic index derived from strain imaging was reduced by balloon inflation and remained low even after the restoration of coronary flow. Tanaka et al reported that successful PCI caused a significant increase in the peak early diastolic strain rate (SRe) on the day after PCI, indicating that PCI might improve regional myocardial relaxation. However, periprocedural coronary microembolization during PCI could negatively affect cardiac function after PCI. Previously, we reported that the amount of coronary microembolization can be estimated as the number of high-intensity transient signals (HITS) in the coronary flow spectrum using a Doppler guidewire. The relation between microembolization and subsequent wall motion abnormality is still unknown. In the present study, we investigated the influence of periprocedural microembolization during PCI on regional myocardial function with Doppler guidewires and strain analysis.
Methods
We performed a prospective study of 25 patients with stable angina pectoris who underwent PCI to the left anterior descending coronary artery from April 2009 to June 2010. The present study complied with the Declaration of Helsinki with regard to investigations of human subjects, and the ethical committee of our hospital approved the study protocol. All patients provided written informed consent to participate in the study. The inclusion criteria were (1) no visible abnormalities in myocardial wall motion on echocardiography, (2) a single de novo lesion, (3) a reference lumen diameter of ≥2.5 mm and lesion length <30 mm, and (4) successful PCI with residual stenosis of <25%. The exclusion criteria were (1) a history of myocardial infarction or PCI, (2) rhythm disturbance, (3) chronic total occlusion, (4) side branch occlusion by PCI, and (5) significant valvular disease or myopathy. Each patient was given aspirin and clopidogrel ≥3 days before PCI, and cardiovascular medicines, including calcium channel antagonists, β-adrenergic blockers, angiotensin-converting enzyme inhibitors, and angiotensin receptor blockers, were continued in the present series of study procedures. On admission day, an echocardiographic examination was performed to obtain routine echocardiographic data, and 2-dimensional images were recorded for off-line analysis. On the next day, coronary catheterization and PCI were performed, and the parameters derived from the Doppler guidewire were obtained. On the day after PCI, an echocardiographic study was performed to obtain 2-dimensional images. We tested blood samples on the day after PCI to measure cardiac troponin T with a point-of-care system (Cardiac Reader; Roche Diagnostics, Indianapolis, Indiana). The measurement range of this system was 0.1 to 2.0 ng/ml, and a value <0.05 ng/ml was defined as negative.
The PCI procedures were performed using a Doppler guidewire (Flo-Map, Volcano Therapeutics, Rancho Cordova, California) as the guidewire for PCI. The tip of the Doppler guidewire was placed 2 cm distal to the target lesion, and the coronary blood flow velocity spectrum was recorded throughout the PCI procedures. We measured the average peak velocity before PCI and 10 minutes after final dilation in the left anterior descending coronary artery. The hyperemic average peak velocity was measured after the intracoronary infusion of papaverine chloride (12 mg for the left coronary artery). The coronary flow velocity reserve was calculated as the ratio of hyperemic average peak velocity to baseline average peak velocity. The coronary blood flow velocity spectrum was digitized and analyzed with an off-line personal computer to count the number of HITS. The principles of detection of microemboli with a Doppler guidewire have been previously described. The detection threshold for Doppler signals was adjusted to a low-intensity level to catch the high-intensity signals. We defined HITS as the following characteristics to distinguish embolic particles from artifacts, such as wire motion: (1) visual high-intensity signals, (2) short duration, and (3) unidirectional signals within the advancing velocity spectrum. HITS usually appears within several beats after balloon deflation, and we focused on the coronary blood flow velocity spectrum from 2 seconds before to 15 seconds after balloon deflation and counted the number of HITS in every PCI process, including before dilation, stent deployment, and after dilation.
The echocardiographic images were obtained using an ultrasound system (Aplio SSA-770A, Toshiba Medical Systems, Tokyo, Japan). All patients were examined in the left lateral supine position, and routine studies were performed. Apical long-axis or 2- or 4-chamber views were acquired and stored for off-line analysis with a high frame rate (45 ± 5 frames/s). A 2-dimensional-speckle tracking software program (Toshiba Medical Systems, Tokyo, Japan) was used to analyze the strain imaging. The endocardial border was manually traced; subsequently, the software allowed automated tracking of the movements of acoustic markers in the myocardium, drawing the strain and strain rate profiles. The peak systolic strain (Ss) was defined as the lowest value obtained for the longitudinal direction throughout the cardiac cycle in the strain profile. The strain rate profile shows 1 negative wave during systole and 2 positive waves during diastole. The peak systolic strain rate (SRs) was defined as the lowest value obtained for the longitudinal direction during systole, and the SRe was defined as the peak value of the earlier wave during diastole. Major left anterior descending coronary artery perfusion territories assigned in the left ventricular segments complied with the definition from the American Society of Echocardiography guidelines. The strain and strain rate parameters in the left anterior descending territory were measured in the apical-septum segments in the 4-chamber view, apical- and midanterior segments in the 2-chamber view, and the apical-anterior and mid-anteroseptal segments in the long-axis view. The average values of the parameters in these segments were used for analysis. The mid-inferolateral segment in the long-axis view was considered the remote control segment. Thirty echocardiographic images were randomly selected to assess the interobserver and intraobserver correlations for the measurement of Ss, SRs, and SRe. To determine the interobserver correlation, the analysis was repeated by a second observer who was unaware of the values obtained by the first observer. To determine the intraobserver correlation, the analysis was repeated 2 weeks later.
All data are expressed as the mean ± SD. All statistical analyses were performed using StatView, version 5.0 software (Abacus Concepts, Berkeley, California). Comparisons were analyzed using 1-way analysis of variance. Simple linear regression analysis was calculated between the number of HITS and the echocardiographic data. p Values <0.01 were considered statistically significant.
Results
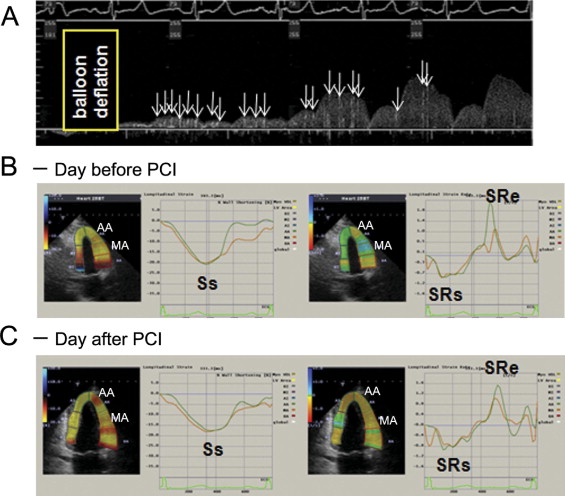
The patient characteristics and baseline hemodynamic and echocardiographic parameters measured at the same time are listed in Table 1 . The 2-dimensional images showed neither visible wall motion abnormalities nor abnormalities in the myocardium itself. PCI was successfully performed without technical complications, and the procedural results are summarized in Table 2 . We also calculated the coronary flow velocity reserve during PCI with the Doppler guidewire both before and after PCI. The coronary flow velocity reserve improved significantly from 1.5 ± 0.5 to 2.7 ± 0.9 (p <0.001). A representative case with a large number of HITS is shown in Figure 1 . Strain analysis demonstrated that Ss, SRs, and SRe worsened on the day after PCI compared to the values on the day before PCI.
| Characteristic | Value |
|---|---|
| Age (years) | 66 ± 8 |
| Men | 18 (72%) |
| Smoker | 6 (24%) |
| Dyslipidemia ⁎ | 19 (76%) |
| Diabetes mellitus | 12 (48%) |
| Baseline echocardiographic parameters | |
| Heart rate (beats/min) | 67 ± 10 |
| Systolic blood pressure (mm Hg) | 134 ± 17 |
| Diastolic blood pressure (mm Hg) | 78 ± 14 |
| Left ventricular diameter at end-diastole (mm) | 46 ± 3 |
| Left ventricular diameter at end-systole (mm) | 28 ± 3 |
| Ejection fraction of left ventricle (%) | 69 ± 8 |
⁎ Defined as low-density lipoprotein ≥140 mg/dl and/or high-density lipoprotein <40 mg/dl and/or triglycerides ≥150 ml/dl.
| Variable | Value |
|---|---|
| Reference diameter (mm) | 2.8 ± 0.5 |
| Minimal lumen diameter (mm) | 0.7 ± 0.3 |
| Lesion stenosis before percutaneous coronary intervention (%) | 75 ± 9 |
| Lesion stenosis after percutaneous coronary intervention (%) | 3 ± 5 |
| Lesion length (mm) | 18 ± 7 |
| Stent type | |
| Cypher | 14 |
| Taxus | 1 |
| XienceV | 10 |
| Stent diameter (mm) | 3.1 ± 0.3 |
| Stent length (mm) | 26 ± 6 |
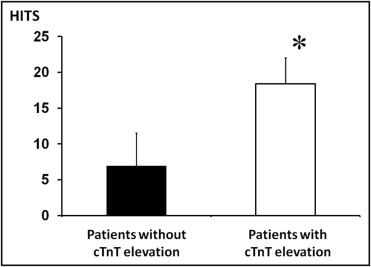
The average total number of HITS observed throughout the PCI procedures was 10 ± 6 (range 0 to 22, median 9). Of the 25 patients, 19 showed no elevation in cardiac troponin T and 6 showed positive cardiac troponin T values on the day after PCI. The total number of HITS was significantly greater in patients with cardiac troponin T elevation than in those without cardiac troponin T elevation (18 ± 4 vs 7 ± 5, p <0.001; Figure 2 ) . None of the patients showed visible wall motion abnormalities on echocardiography on the days before and after PCI. After PCI, the mean heart rate and systolic and diastolic blood pressure measured at the echocardiographic study were unchanged compared with the pre-PCI values (68 ± 11, 132 ± 15, and 76 ± 14, respectively). The myocardial strain and strain rate are listed in Table 3 . No differences were seen in the baseline values for Ss, SRs, and SRe between the remote control area and the left anterior descending territory. The Ss, SRs, and SRe did not change after PCI in either the remote area or the left anterior descending territory. To account for the effect of microembolization, we divided the study population into 2 groups according to the median number of HITS. In patients with a total number of HITS of ≥10 (large number of HITS group, n = 11), the myocardial strain and strain rate on the day after PCI were significantly lower than those on the day before PCI, suggesting that a large amount of microembolization reduced regional cardiac function ( Figure 3 ). In patients with a total number of HITS <10 (n = 14), Ss and SRe on the day after PCI were greater than those on the day before PCI, suggesting that the restoration of myocardial ischemia might contribute to the improvement in those parameters ( Figure 3 ). Next, we explored the correlations between the total number of HITS and the changes in Ss, SRs, and SRe. We calculated the rates of change in Ss, SRs and SRe as the ratios of those parameters after PCI to those before PCI. A modest inverse correlation was seen between the total number of HITS and the rate of change in Ss (R 2 = 0.35, p <0.01; Figure 4 ) . No correlation was seen between the total number of HITS and the rate of change in SRs (R 2 = 0.15, p = 0.053; Figure 4 ); however, a strong inverse correlation between the total number of HITS and the rate of change in SRe (R 2 = 0.46, p <0.001) was observed ( Figure 4 ). All patients with cardiac troponin T elevation were in the large number of HITS group.