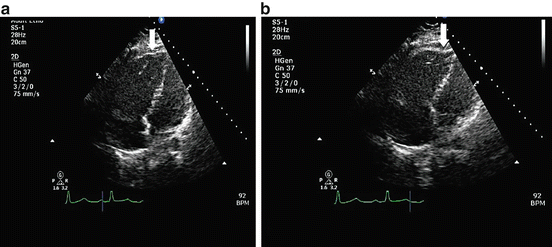
Fig. 9.1
(a) Tricuspid annular plane systolic excursion (TAPSE) in M-mode obtained in the apical four chamber view. The distance between the end-diastolic (a) and end-systolic points (b) is the TAPSE (2.3 cm). (b) Illustrates the RV end-diastolic length (7.8 cm) from the tricuspid valve plane to the RV apex. It also demonstrates the RV end-diastolic area (20.5 cm2). (c) Represents the RV end-systolic length (5.6 cm). The difference between these two measurements is the 2D TAPSE (2.2 cm). It also demonstrates RV end-systolic area (12.5 cm2). RVFAC is therefore [(20.5 − 12.5/20.5) × 100] = 40 %
The orientation of muscle fibers of the RV dictates that the majority (77 %) of area change during systole occurs in the longitudinal direction [3, 11]. Systolic displacement of the RV base, referred to as tricuspid annular plane systolic excursion or (TAPSE) correlates strongly (r = 0.79–0.92) with RV ejection fraction derived from radionuclide angiography [4]. TAPSE can be derived from 2D echo or M-Mode and is highly reproducible due to its freedom from geometric assumptions and lack of reliance on endocardial definition (Fig. 9.1). A normal TAPSE ranges from 2.4 to 2.7 cm [11–14]. A TAPSE < 1.8 cm predicts a stroke volume index <29 ml/m2 with 87 % accuracy, and is associated with increased hospitalization rates for right heart failure and decreased survival in patients with PAH [10, 12]. Ghio et al. recently showed in a PAH cohort that a TAPSE ≤ 1.5 cm was associated with a nearly threefold higher event rate (death or emergent lung transplant) versus subjects with a TAPSE > 1.5 cm [15]. Of note, Raina et al. have demonstrated that compared to normal subjects, patients who undergo cardiac surgery demonstrate a change in the pattern of their RV contraction, such that their average TAPSE was 1.6 cm while maintaining normal global RV function. In the post-operative subjects, there was a loss of longitudinal RV contraction relative to transverse shortening. This is likely related to geometric changes in the RV that occur following pericardiotomy. Therefore, a global measure of RV function such as RVFAC is preferred in patients with prior cardiac surgery and pericardiotomy [16].
Another method of longitudinal RV function assessment utilizes the velocity of RV longitudinal shortening via tissue Doppler imaging TDI (denoted S′). S′ correlates strongly with TAPSE and is similarly a reproducible method of RV function assessment [17]. An S′ <10 cm/s predicts a cardiac index <2.0 l/min/m2 with 89 % sensitivity and 87 % specificity [18]. Additionally, the RV TDI signal can be integrated to measure the longitudinal tissue displacement, which is numerically identical to TAPSE. Using ROC curve analysis, an RV tissue displacement >1.5 cm predicted an RV stroke volume index ≥30 ml/m2 (AUC 0.79); changes in RV tissue displacement strongly correlated to changes in RV stroke volume index in response to intravenous epoprostenol infusion (Fig. 9.2) [19].
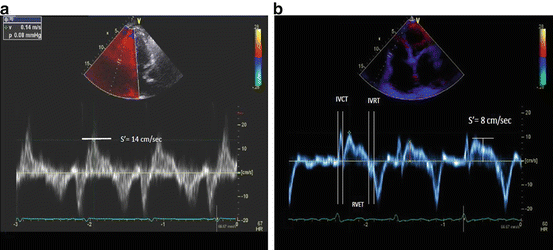

Fig. 9.2
Right ventricular Tissue Doppler imaging obtained along the basal one-third of the RV free wall in the longitudinal plane. The peak longitudinal shortening velocity is denoted as S′ and is measured at 14 cm/s in panel (a), and 8 cm/s in panel (b). Right ventricular myocardial performance index (in panel b) can be obtained from the isovolumic contraction time (IVCT), relaxation time (IVRT), and ejection time (RVET)
The myocardial performance index (MPI) integrates systolic and diastolic parameters in a single measure. Using tissue Doppler signals the time intervals of isovolemic contraction (IVCT), isovolemic relaxation (IVRT), and RV ejection time (RVET) are measured to derive the MPI (IVRT + IVCT/RVET) (Fig. 9.2). A higher MPI value is associated with worse RV function and survival in PAH [20].
An additional method of assessing RV function is the averaged longitudinal RV free wall strain as assessed by speckle tracking [21]. In this study, persistence of or progression to a severe reduction in free wall systolic strain (<−12.5 %) at 6 months was associated with greater disease severity and diuretic use. higher mean pulmonary artery pressure, and poorer survival (4-year mortality 43 % vs. 23 %, p = 0.002). After adjusting for age, functional class, and RV strain at baseline, patients with ≥5 % improvement in RV free wall systolic strain had a greater than sevenfold lower mortality risk at 4 years (hazard ratio 0.13, 95 % confidence interval 0.03–0.50, p = 0.003).
All echocardiographic measures of RV function assessment are load (especially afterload) dependent. Although this can be viewed as a limitation, the fact that RV dysfunction in PAH is largely afterload dependent allows changes in RV function to inform the clinician on responses (or lack thereof) to PH specific medical therapy.
Right Ventricular Size, Shape, Septal Position
The first response of the RV to a rise in pulmonary arterial load is RV dilatation, which serves as a compensatory response which may assist in the maintenance of RV stroke volume (heterometric autoregulation). The normal RV measures approximately 2.5–3.5 cm at end-diastole, with a planimetered area of 15–18 cm2. Of note, the presence of RV dilatation does not always signify RV systolic dysfunction. A dilated RV with normal or dynamic function often signifies excess preload only, with the rise in RV function occurring in response to volume loading and increased sarcomere length. This is often the case in primary tricuspid valve and pulmonic valve regurgitation as well as in the presence of systemic to pulmonary shunt conditions. A practical rule is that in the absence of moderate or greater tricuspid or pulmonic regurgitation, a dilated and hyperdynamic RV should alert the clinician to the presence of a systemic to pulmonary shunt.
A practical way to estimate RV size is to compare RV dimensions to LV dimensions (or area) in the apical four chamber view. RV dimensions are obtained at the RV base, approximately 1 cm apical of the tricuspid annulus. A diastolic RV/LV diameter ratio of 0.5–0.7 is considered normal, with increasing RV:LV ratios in patients with mild (0.8–1.0), moderate (1.1–1.4), and severe (≥1.5) RV dilatation. A useful rule of thumb is that the RV:LV ratio should be <1.0, and any value >1.0 is strongly suggestive of RV dilatation, often coinciding with RV dysfunction (Fig. 9.3) [22].
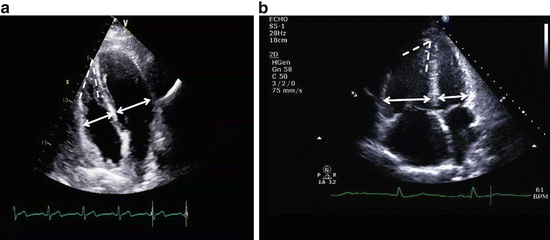

Fig. 9.3
(a and b) Apical four chamber view. Panel (a) demonstrates a normal RV:LV dimension ratio (<1.0) and normal RV shape, given the relative tapering of the RV dimension from base to apex. Note the relatively acute RV apex angle in this patient with a normal PVR. Panel (b) represents a patient with PAH, whom has a markedly increased RV:LV ratio (1.5). Note the relative lack of tapering of RV dimensions from base to apex and the open RV apex angle. The RV is apex-sharing with the LV. These findings is panel b are highly consistent with PH related to a high PVR
The apex of the heart is normally formed by the LV. In cases of RV enlargement related to increased RV afterload, the RV will occupy or share the apex of the heart (apex-forming RV). This is associated with widening (opening) of the angle of the RV apex which is normally acute in the apical four chamber view. Lopéz-Candeles showed that a relatively large or “open” RV apical angle was a common finding in the setting of chronic pulmonary hypertension, relating inversely to decreases in TAPSE and RV fractional area change [23]. In our experience, a dilated and open RV apex angle is quite specific for PH related to high afterload conditions such as PAH and CTEPH. In PVH and other PH conditions where the PVR is normal, the RV apex angle will remain rather acute or “closed,” imparting an inverted triangle shape to the RV, where the dimension tapers quickly from base to RV apex (Figure 9.3).
As the RV dilates, the potential space in the pericardium is obliterated leading to pericardial constraint. With increasing constraint of the heart, further dilatation of the RV leads to shifting of the IVS from right to left (an example of diastolic ventricular interdependence), leading to a fall in LV cavity size and impaired LV diastolic filling [24]. As a result, the transmitral Doppler filling pattern will demonstrate reversal of early (E) versus late (A) diastolic waveforms on pulsed wave Doppler mitral inflow (so-called E to A reversal) in patients with PAH or CTEPH [25]. Confusion can sometimes arise if the clinician wrongly assumes that reversal of E/A ratio (often reported as “Grade I diastolic dysfunction”) equates to elevated LA pressure and hence attributes the PH to left sided diastolic dysfunction. In the presence of RV dilation and significant right to left septal shifting, the presence of a reversed E/A ratio is a strong indicator of normal left atrial pressure. Moreover, when septal IVS shift is due to PAH or CTEPH and alleviated by treatment, LV diastolic filling returns to normal [26, 27].
Additionally, RV dysfunction is associated with a delay in the time to peak RV contraction, which leads to mechanical RV/LV dyssynchrony [28]. This RV/LV dyssynchrony leads to systolic septal flattening which is characteristic of high RV afterload states. Magnetic resonance imaging studies have shown relatively strong correlations between the degree of RV systolic septal bowing and pulmonary vascular resistance [26, 28]. Systolic septal flattening is nearly always present in PAH and CTEPH, and thus functions as a reliable and practical indicator of increased pulmonary arterial afterload (Fig. 9.4).
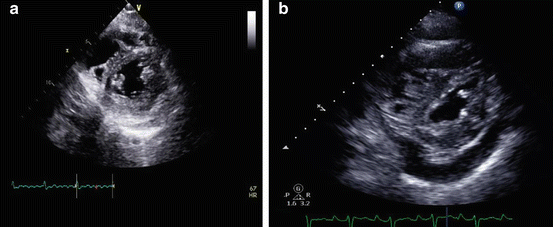

Fig. 9.4
(a and b) Short axis images at the midventricular level demonstrating mild (a), and more marked (b) systolic septal flattening in patients with mild, and more advanced pulmonary vascular disease. The presence of systolic septal flattening is present in PH associated with a high PVR, however, is typically absent in PH in the setting of a normal PVR (i.e., PVH). Also note the presence of a small to moderate size pericardial effusion (panel b), which is indicative of a high right atrial pressure, poor RV function and worse prognosis in PAH
Mild to moderate pericardial effusion is a common finding, occurring in about 50 % of patients with PAH [29]. It has long been recognized as poor prognostic sign in PAH, often signifying relative RV decompensation (Fig. 9.4b). The accumulation of pericardial fluid in PAH likely occurs due to chronically elevated RA pressure, which in turn impairs coronary venous return and results in transudation of fluid into the pericardial space [30]. Importantly, attempts at pericardial drainage (surgical or catheter based) should be avoided unless there is compelling evidence of tamponade, as the effusion is typically the result and not the cause of RV failure in this setting and mechanical drainage of the effusion in some series was associated with unacceptably high mortality rates [31]. Others have achieved success in draining pericardial effusions in PAH with low procedural mortality [32]. In our experience, in the absence of frank tamponade, pericardial effusions may resolve over weeks or months if the PAH and RV failure respond to diuresis and PH specific medical therapy.
RA enlargement is another indirect measure of RV dysfunction. An increased RA area index is predictive of increased mortality in PAH. While RA dilatation might be seen as simply a marker of progressive RV failure and worsening TR, more recent work suggests that RA systolic function may account for upwards of 50 % of total longitudinal RV shortening in patients with PAH [33–35]. Therefore, the RA may play a larger role in maintaining total right heart function than previously appreciated.
Doppler Examination
Pulmonary arterial load (the afterload of the RV) and pulmonary artery pressure should not be viewed as synonymous. Afterload is the force that opposes flow, whereas pressure results from the interaction between flow and afterload. Since pressure does not oppose flow, it cannot be considered afterload. This fundamental physiologic distinction is supported by the fact that PA pressure correlates poorly with RV function and prognosis in patients with PAH [35]. Moreover, there are conditions where pressure is low and afterload is high (i.e., acute PE) and where pressure is high and afterload is low (i.e., systemic to pulmonary shunt with PH from high pulmonary blood flow). RV afterload is better represented by pulmonary vascular resistance rather than pressure. Thus, practically speaking when a clinician notes PH + RV dysfunction a high PVR should be suspected, whereas when PH is present without RV dysfunction, low PVR PH conditions are far more likely, such as left-sided diastolic HF.
Despite its shortcomings as a measure of RV afterload, PA pressure remains an important component in the evaluation of established or suspected pulmonary hypertension since some elevation is nearly always present in varying degrees in patients with PVD. A pulmonary artery systolic pressure (PASP) of 40 mmHg has been traditionally accepted as the upper limit of normal in most subjects, although the upper limit of PASP may be slightly higher in advancing age. The echocardiographic discovery of an elevated PA pressure is usually, although not ideally, what triggers further workup for PH, and therefore, it is important to review the echocardiographic assessment of PA pressure [36–38]..
The PASP is most commonly estimated through continuous wave Doppler interrogation of the tricuspid regurgitant jet velocity, which provides an estimate of the pressure gradient between the RV and the RA [39]. This gradient, when added to RA pressure, should equal the systolic RV pressure, which in turn should equal PASP in the absence of pulmonic valve stenosis. In the latter case, the PASP can still be estimated by subtracting the gradient across the pulmonic valve from peak RV systolic pressure. This approach utilizes the modified Bernoulli equation: PASP ≈ 4v 2 + estimated RA. The v represents the velocity of the tricuspid regurgitant jet. The use of a high quality TR jet signal with a clearly defined peak velocity ensures the highest chance of an accurate and reproducible PASP estimate (Fig. 9.5).
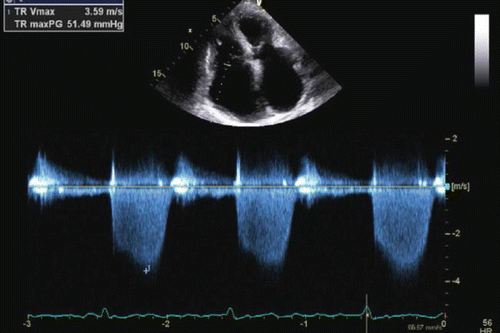

Fig. 9.5
Apical four chamber view with continuous wave Doppler interrogation across the tricuspid valve. The peak velocity is 3.6 m/s, thus estimating a pressure gradient between the right ventricle and right atrium of 51 mmHg. This added to an RA pressure estimate will estimate PA systolic pressure. The high quality Doppler signal with a clearly defined peak lends to more reproducible and reliable pressure estimation
The most common method of RA pressure assessment utilizes inferior vena cava (IVC) size and collapsibility with inspiration [40, 41]. Unfortunately, this method has not proved very reliable, likely because the size of the IVC is governed not only by the RA pressure, but also by the compliance of the IVC and the degree to which the negative pleural pressure is transmitted to it [42–44]. Another way of estimating RA pressure was recently described. Using the ratio of tricuspid inflow E velocity to tricuspid annular tissue Doppler E a wave velocity (E/E a) yielded values that correlated well (r = 0.8) with invasively measured pressures [45]. However, given the significant variation in these techniques, we prefer to use the clinically estimated RA pressure, when possible.
Data on the accuracy of Doppler echo assessment of PA pressure have been disappointing [42, 46]. This is largely due to the fact that in many patients the ideal conditions of a high quality TR jet signal, proper Doppler alignment, and accurate RA pressure estimation do not exist. Fisher et al. examined the correlation between Doppler estimated and invasively measured PA systolic pressure in a cohort of 65 patients with more severe pulmonary hypertension (62 % with pulmonary arterial hypertension) [42]. Using Bland-Altman analysis, 48 % of the patients had an estimated PA systolic pressure that was 10 mmHg or more different from invasively obtained measurements. Pressure overestimations were due to either overestimation of the peak velocity signal, or an overestimation of the RA pressure by IVC size and collapsibility assessment (Fig. 9.6). Underestimations were also common, and more pronounced (−30 mmHg) than overestimations (+19). Suboptimal TR jet signal quality was the most common reason for PASP underestimation (Fig. 9.6). Nonetheless, in the study by Fisher et al., the absence of TR did not necessarily equate to the absence of pulmonary hypertension, as four of the six subjects with no TR had severe pulmonary hypertension by catheterization. In addition, 12 of the 16 patients in whom PA pressure was underestimated by Doppler had evidence of RV enlargement and/or dysfunction on their Doppler echo exam. Thus, if the PASP estimate is <40 mmHg in the presence of significant RV dilation, dysfunction or septal flattening, the clinician should remain highly suspicious for the presence of significant PH and the patient should be referred for right heart catheterization.
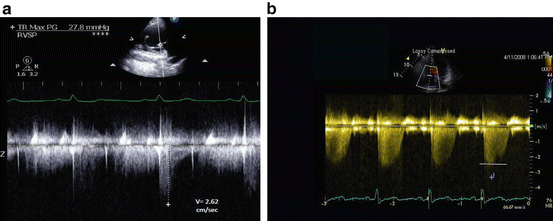

Fig. 9.6
(a) Example of pulmonary artery systolic pressure underestimation by continuous wave Doppler method. Note the Doppler signal dropout and a poorly defined peak TR velocity. The peak velocity is estimated at 2.62 m/s, estimating an RV to RA gradient of about 28 mmHg and PA systolic pressure of 40 mmHg. A right heart catheterization within 24 h of the echo examination revealed a pulmonary artery systolic pressure of 75 mmHg. (b) Example of pulmonary artery systolic pressure overestimation by the continuous-wave Doppler method. The reported peak velocity is 3.4 m/s, estimating a gradient between the RV and the RA of 46 mmHg. However, the true peak velocity is 2.3 m/s (denoted by horizontal line), estimating a RV-RA gradient of only 21 mmHg. This figure highlights the importance of measuring the peak velocity carefully, as the peak velocity is squared, thus amplifying the error
An alternative or complementary method of pulmonary artery pressure assessment utilizes the acceleration time (AcT) (Fig. 9.7) of the pulsed wave Doppler flow velocity envelope in the right ventricular outflow tract (RVOT Doppler) [mean PAP = 79 − 0.45 (RVOT AcT)] [47]. This measure is simple, reproducible, and inversely correlates with mean PA pressure (mPAP). Moreover, AcT may be a better marker of pulmonary artery impedance/right ventricular afterload than pressure; thus, in two patients with equal mPAPs, the patient with a high AcT (i.e., >100 ms) will have a relatively normal PVR, whereas a patient with an AcT less than 100 ms is more likely to have an increased PVR and right ventricular afterload.


Fig. 9.7
Pulsed wave Doppler signals from the RV outflow tract. Panel (a) demonstrates a non-notched flow velocity envelope. Panel (b) is more triangular with a late-systolic notching pattern. Panel (c) has a pronounced mid-systolic notching pattern. The difference in the shape of the Doppler patterns is largely determined by differences in pulmonary vascular resistance, not PA pressure. Also shown are times to peak velocity or acceleration times (AcT) from the same pulse wave Doppler interrogation of the right ventricular outflow tract. Panel (a) an AcT = 123 ms, consistent with normal mean pulmonary artery pressure and resistance. Panel (b) illustrates an AcT = 78 ms, in a patient with a pulmonary vascular resistance (PVR) of 6 WU. Panel c demonstrates marked mid systolic notch and shorter AcT, in this case associated with a PVR of 11 WU
In addition to systolic and mean PA pressures, the diastolic PA pressure (PADP) can be derived from the end-diastolic point of the pulmonary regurgitation signal, again added to an estimate of right atrial pressure [48]. Alternatively, PADP can be estimated from the velocity obtained from the TR jet at the time of pulmonic valve opening [49, 50]. In either case, the accuracy of the method is contingent on the presence of PR or TR and the quality of the respective Doppler envelopes.
The most important thing to remember about Doppler derived PA pressure assessment is that it should be taken in the context of the clinical condition and, importantly, in the context of other echocardiographic features such as RV size, RV apex morphology, RV systolic function and septal position. Using this more integrated approach provides a far more comprehensive PH assessment and greatly offsets the potential for PH misdiagnosis by PASP Doppler estimation alone.
As discussed earlier, an elevated PVR is the hallmark of PHPVD. Doppler echocardiography can also be used to estimate PVR. Abbas et al. showed that the ratio of trans-tricuspid flow velocity (surrogate of pressure) to the velocity-time interval obtained from the RV outflow tract (RVOT VTI) (surrogate of flow) closely correlates to PVR [51]. This approach estimates PVR well when PVR is low (<2 WU), but does not correlate well in the setting of elevated PVR (>8 WU) [52]. Additionally, as this ratio correlates with total pulmonary resistance (mPAP/cardiac output) rather than PVR alone, this measure could lead one to believe that an elevated ratio is related to elevated PVR (i.e., PVD), when the total pulmonary resistance is actually elevated secondary to left atrial hypertension. Another formula, proposed recently, derives PVR from the ratio of PASP to RVOT VTI, with a corrective constant (+3) in the setting of mid-systolic notching of the RVOT Doppler signal (vide infra). This method (PVR = [(PASP/RVOT VTI) + 3]) demonstrated an area under the curve (AUC) of 0.95 and 0.92 for PVR more than 3 and 5 WU, respectively, and was 98 % sensitive and 61 % specific for predicting PVR more than 3 WU [53].
A simpler approach to estimating PVR relies on the visual inspection of the pulsed wave Doppler profile in the RVOT (RVOT Doppler). In the setting of normal RV afterload (normal PVR), the RVOT Doppler signal is rounded and parabolic in shape, with no evidence of systolic deceleration or “notching” of the Doppler profile (Fig. 9.7a). In the setting of an increased PVR and decreased pulmonary artery compliance, the RVOT Doppler signal will demonstrate evidence of “notching,” that can occur in late systole (Fig. 9.7b) or mid-systole (Fig. 9.7c). RVOT Doppler notching arises from alteration of the flow pattern exiting the RV due to early arrival of reflected pressures waves from a constricted and noncompliant pulmonary circulation [54–56]. Mid-systolic notching is 96 % specific for a PVR > 5 WU, a mean PVR of 9 WU, and is associated with a greater degree of right heart dysfunction than the late notch pattern, which is typically associated with a PVR of 3–6 WU and less severe right heart dysfunction [57]. In this study, a notched RVOT Doppler profile was strongly associated with a PVR > 3 WU (odds ratio 29:1), and was present in 100 % of patients with incident PAH. On the other hand, subjects with PH in the absence of Doppler notching are far more likely to have pulmonary venous congestion and left heart disease as the source of their PH (odds ratio 33:1). Visual inspection of the RVOT Doppler profile for the presence of absence of “notching” is a very simple, powerful, and practical way to detect PHPVD and should be incorporated into the routine echo-Doppler examination of every patient with known or suspected PH.
Role of Echo-Doppler Beyond Initial Screening for PH
Pulmonary Arterial Hypertension (PAH)
As discussed previously, pulmonary vascular disease alters the normal structure of the right heart and Doppler flow profile in a consistent and reproducible manner, such that the presence of certain findings provides powerful diagnostic information irrespective of the Doppler PASP estimate. The echocardiographic features of idiopathic pulmonary arterial hypertension (IPAH) were described in the early 1970s by Goodman et al. [58]. They showed that the vast majority of patients with PAH had evidence of RV dilatation and systolic septal flattening. In a subsequent series, RV dilatation (98 %) and systolic septal flattening (90 %), were common, with a high prevalence of RV systolic dysfunction (76 %). In this same study, the investigators demonstrated a relatively low correlation between PAP estimated by Doppler and measured invasively (r = 0.31) [59]. They also showed that the RVOT AcT was abnormal in the majority of the patients (AcT < 100 ms), which parallels the observation that the RVOT Doppler profile is consistently and reproducibly altered in PHPVD (Doppler notching pattern), as shown by Arkles et al. [57] Bossone et al. also showed that moderate to severe TR was common as was the reversal of E/A ratio on mitral inflow Doppler. In fact, 70 % of the PAH patients demonstrated E to A reversal (grade 1 diastolic dysfunction) while none of the subjects had an elevated LA pressure on invasive measurement. As discussed above, transmitral Doppler E to A reversal in the setting of echo-Doppler features of PAH is a very strong indicator for the presence of normal LA pressure.
A notched RVOT Doppler profile has been observed in 100 % of patients with incident PAH. In contrast, the absence of RVOT notching in a patient with pulmonary hypertension strongly correlated with a PVR < 3 WU and a wedge pressure of >15 mmHg [57].
From a prognostic standpoint, it seems that either indirect or direct measure of impaired right heart performance can be associated with adverse outcome in PAH. The presence of a pericardial effusion is seen in about 15 % of patients with PAH and is associated with an adverse prognosis, likely related to chronically elevated right atrial pressure. Impaired LV diastolic filling (related to the degree of septal flattening and LV compression) and a high RA area index are also associated with worse outcome [35].
Similarly, an RV MPI ≥ 0.83 is associated with a lower event free survival at 5 years as opposed to those with RV MPI < 0.83 [20]. Others have demonstrated that in patients with PAH a TAPSE of <1.8 cm corresponded to higher catheter derived right atrial pressure, lower stroke volume index, greater RV dilatation and septal bowing, and a higher incidence of pericardial effusion. Two-year survival estimate for those patients was 50 % as opposed to 80 % for those with a TAPSE ≥ 1.8 cm [10].
Chronic Thromboembolic Pulmonary Hypertension (CTEPH)
In about 4 % of patients with prior pulmonary embolism (PE), incomplete clot resolution leads to residual obstruction in the pulmonary circulation, resulting in CTEPH. Unlike PAH, which is largely a disease of the small pulmonary vessels, the circulatory impedance in CTEPH arises from obstruction and remodeling of both large and small arteries [60, 61]. The small vessel disease component of CTEPH leads to similar 2D echocardiographic findings as PAH, with the triad of RV dilatation, RV systolic dysfunction and septal flattening being highly prevalent. Thus, any patient with these 2D echocardiographic findings should undergo ventilation perfusion scanning to exclude CTEPH. The presence of proximal, large vessel obstruction in CTEPH leads to relatively greater pulsatility in the pulmonary circulation, which can be appreciated by echo-Doppler examination or right heart catheterization in the form of a high PA pulse pressure relative to mean PA pressure (referred to as the fractional pulse pressure (FPP); PA pulse pressure/mean PA pressure). A FPP > 1.4 is very suggestive of CTEPH as opposed to PAH in which the FPP is usually around 0.8 [62, 63]. Doppler estimated FPP of 1.35 differentiates CTEPH from IPAH with a sensitivity of 95 % and a specificity of 100 % in one series [64].
In addition, it has long been observed that a notched RVOT Doppler profile is present in the setting of acute and chronic PE, owed to early arrival of reflected pressure and flow waves arising from proximal PA obstruction. Hence, RVOT Doppler notching is also seen in acute and chronic PE. Moreover, early or mid-systolic notching of the RVOT Doppler profile predicts the greatest benefit from pulmonary thromboendarterectomy (PTE) in CTEPH patients [55].
Acute Pulmonary Embolism
Pulmonary embolism (PE) is a very common cause of morbidity and mortality in the USA. Fortunately, most PE’s are small and have little to no hemodynamic consequence, and are thus not appreciated by echocardiography [65]. However, in the setting of larger and more centrally located PE, the RV is exposed to a sudden and dramatic rise in afterload to which it is not well designed to overcome [66, 67]. This leads to a rapid uncoupling of the RV–PA circuit, abrupt RV dilatation, RV dysfunction and varying degrees of pulmonary hypertension [68, 69]. Due to the sudden rise in afterload and relative inability to generate normal or large stroke volumes, the degree of PH is typically less severe in acute PE with the PASP usually <60 mmHg (mean <40 mmHg) [65]. As a result, the degree of RV dilatation and dysfunction is more informative to clot burden in the PA circuit than the degree of PH [69]. Moreover, in the setting of acute PE, a McConnell’s sign is frequently observed, referring to the relative sparing of transverse shortening of the distal one-third of the RV near the apex, while the remainder of the RV is hypokinetic (Fig. 9.8). This phenomenon likely results from tethering of the RV apex by a normal or hyper-contractile LV through forces transmitted across the IVS and shared fibers between the LV and RV [70].

