Chapter 5
Echocardiography
1. How does echocardiography work?
Appropriateness criteria for obtaining an echocardiogram are given in Box 5-1.
2. What is the difference between echocardiography and Doppler?
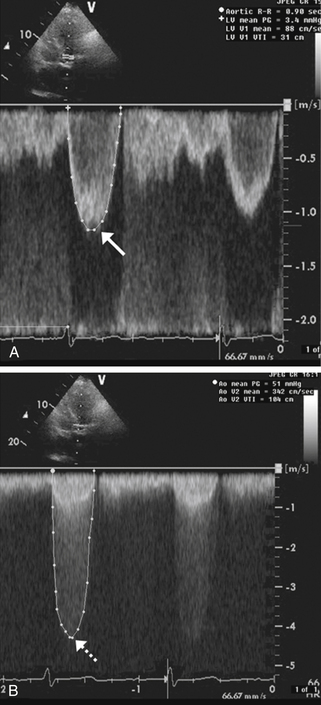
 Pulsed Doppler (Fig. 5-1, A), which can localize the site of flow acceleration but is prone to aliasing

Figure 5-1 Doppler assessment used in patients with aortic stenosis. A shows pulsed Doppler in the left ventricular outflow tract in a patient with aortic stenosis. The peak velocity of the spectral tracing (arrow) is 1.2 msec, indicating normal flow velocity proximal to the aortic valve. B shows continuous Doppler across the aortic valve revealing a peak velocity of 4.5 msec (dashed arrow). Therefore, the blood-flow velocity nearly quadrupled across the stenotic aortic valve, consistent with severe aortic stenosis.
 Continuous-wave Doppler (Fig. 5-1, B), which cannot localize the level of flow acceleration but can identify very high velocities without aliasing
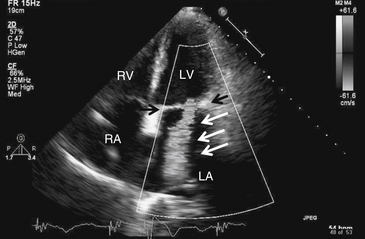
 Color Doppler (Fig. 5-2), which uses different colors (usually red and blue) to identify flow toward and away from the transducer, respectively, and identify flow acceleration qualitatively by showing a mix of color to represent high velocity or aliased flow

Figure 5-2 Mitral regurgitation. Apical four-chamber view with color Doppler revealing severe mitral regurgitation (white arrows). Black arrows point to the mitral valve. Note that in actuality, the regurgitant jet is displayed in color, corresponding to the flow of blood. LA, Left atrium; LV, left ventricle; RA, right atrium; RV, right ventricle.
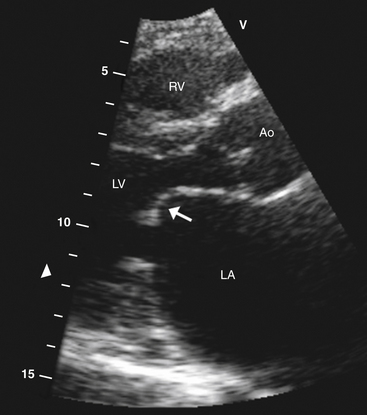
Doppler is particularly useful for assessing the hemodynamic significance of cardiac structural disease, such as the severity of aortic stenosis (see Fig. 5-1), degree of mitral regurgitation (see Fig. 5-2), flow velocity across a ventricular septal defect, or severity of pulmonary hypertension. The great majority of echocardiograms are ordered as echocardiography with Doppler to answer cardiac morphologic and hemodynamic questions in one study (e.g., a mitral stenosis murmur); 2-D echo to identify the restricted, thickened, and calcified mitral valve (Fig. 5-3); and Doppler to analyze its severity based on transvalvular flow velocities and gradients.

Figure 5-3 Parasternal long-axis view showing typical hockey stick appearance of the mitral valve (arrow) in rheumatic mitral stenosis. Ao, Aortic valve; LA, left atrium; LV, left ventricle; RV, right ventricle.
3. How is systolic function assessed using echocardiography?
Stay updated, free articles. Join our Telegram channel

Full access? Get Clinical Tree


