ECHOCARDIOGRAPHIC EVALUATION OF NEONATES WITH SUSPECTED HEART DISEASE
Introduction
Functional abnormality of the cardiovascular system in the neonate may be recognized by cyanosis, signs of congestive heart failure (CHF), respiratory distress (tachypnea, hyperpnea, and/or retractions), or a combination thereof.1,2 Or, it may be detected because of the recently introduced pulse oximetry screening3 of neonates (see Chapter 9). Diagnosis may be suspected or made by an evaluation of the patient’s history, physical examination, chest x-ray, ECG, pulse oximetry, blood gas analysis, and, if necessary, PO2 response to 100% oxygen, as reviewed in Chapter 10. Echocardiography is useful in excluding significant heart disease, in confirming clinically suspected cardiac disease, and in defining multiple issues helping to formulate treatment plans. Consequently, echo-Doppler studies have almost completely replaced cardiac catheterization for diagnostic purposes. In this chapter, the author outlines the techniques of echocardiography and Doppler studies, illustrates its usefulness in excluding or confirming heart disease in the newborn, and demonstrates echocardiographic examples of commonly encountered heart defects.
What Is Echo-Doppler?
Ultrasound may be defined as sound above the audible range, usually >20,000 cycles/second. The ultrasound used for medical purposes is within 2 to 10 MHz (millions of cycles/second) and it obeys the laws of reflection. The ultrasound is produced by “piezoelectric” crystals which are either naturally occurring quartz or commercially made barium titanate or lead zirconate. Commercially available transducers transmit ultrasound for one-millionth of a second and receive echoes for 1,000 times longer. When the ultrasound strikes an interface between 2 materials that have different acoustic impedances, it is reflected and an echo is formed. When this echo is returned to the transducer, the crystal in it vibrates. This vibration is perceived electronically and displayed as a dot. This dot, when recorded on a strip-chart recorder, against time on the X-axis, will become a line. This is motion or “M-mode” echo (Figure 11.1). Two-dimensional (2D) echo is derived by the same mechanism as the M-mode echo, but spatial information is added; this is with respect to the location of the beam at the time the information is received with the help of a line locater circuitry. This 2D echo (Figure 11.2) is the most common form used for the evaluation of the heart. Table 11.1 provides a summary of the principles of echo-Doppler techniques.
Table 11.1. Summary of ultrasound, echo, and Doppler techniques
| Ultrasound |
|
| Echo | Reflected ultrasound. When ultrasound strikes an interface between 2 materials that have different acoustic impedances, it is reflected to produce the echo |
| Motion or “M-mode” echo (Figure 11.1) | Echo recording against time on the X-axis |
| 2D echo (Figure 11.2) | Echo recording with spatial information added with respect to the location of the beam at the time the information is received (line locater circuitry) |
| Doppler |
|
| Pulsed Doppler (Figures 11.3 and 11.4) |
|
| CW Doppler (Figure 11.5) |
|
| HPRF Doppler (Figure 11.6) |
|
| Color Doppler (Figure 11.7) |
|
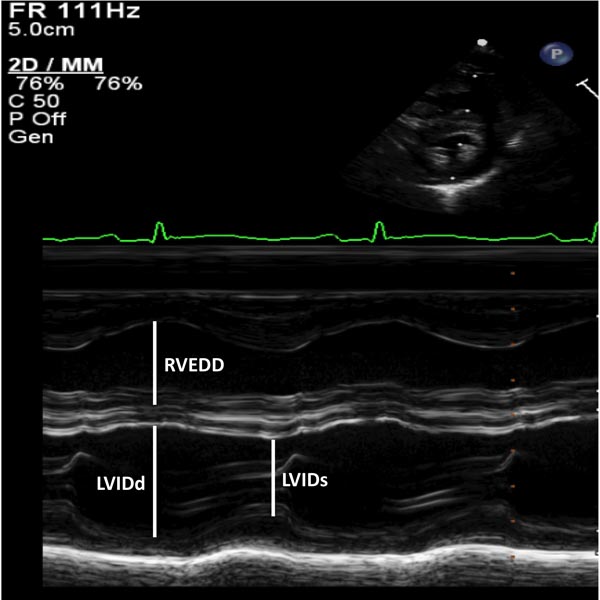
Figure 11.1. M-mode recording of the ventricles demonstrating measurements of LVIDd and RVEDD, both measured at the onset of QRS complex of the simultaneously recorded ECG and of left ventricular internal dimension in end-systole (LVIDs). The data are compared with normal values and z score is determined. These data are also used for the calculation of left ventricular shortening fraction (see the text) to assess the left ventricular systolic function.
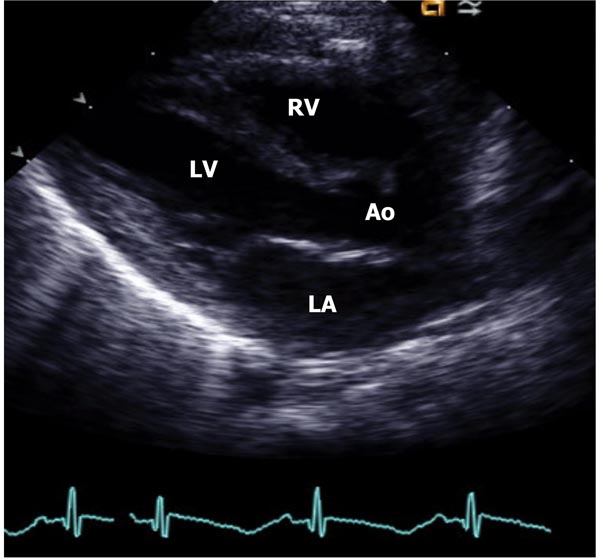
Figure 11.2. Parasternal long-axis view of the heart in a normal neonate demonstrating LA, LV, Ao, and RV. Mitral and aortic valves, and interventricualr septum are also seen, but not marked.
In the above-described imaging echocardiograms, the targets for ultrasound reflection are heart valves, myocardium, vessel walls, and other cardiac structures. The reflections from blood cells of low intensity are discarded. In Doppler, the low-magnitude echoes from the blood cells are amplified and studied using the Doppler principle: an apparent shift of transmitted frequency occurs as a result of motion of the target. Frequency shift of transmitted to received wavefronts may be analyzed by fast Fourier transform, Chirp-Z analysis, or zero-crossing detector, and velocity is calculated (see Table 11.1). The velocity information thus derived is useful in cardiac ultrasound/Doppler. A number of Doppler techniques are utilized to acquire “physiologic” information and these include pulsed Doppler, continuous wave (CW) Doppler, high pulse repetition frequency (HPRF) Doppler, and color Doppler, each with a specific purpose.4–7
Pulsed Doppler uses single crystal, similar to an echo. A small area along the ultrasound beam (UB) can be studied, called “range gating.” The area from which range gating is obtained is called “sample volume.” The location (Figures 11.3 and 11.4) and size of the sample volume can be varied and is generally used to demonstrate normal flow velocities and to localize flow disturbance. The advantage of this technique is that exact location of sample volume can be chosen by the examiner and the site of flow disturbance can be localized. However, the disadvantage is that high-velocity flows cannot be recorded because of low Nyquist limit of the pulsed Doppler and aliasing of the Doppler signal at high velocities. While several techniques (shifting baseline to top or bottom, adding the wrap around value to the velocity, using a lower frequency transducer, reducing the distance to target, increasing the intercept angle) are available to circumvent aliasing, by and large, CW Doppler and HPRF Doppler are used to measure velocities higher than those recorded by the pulsed Doppler.
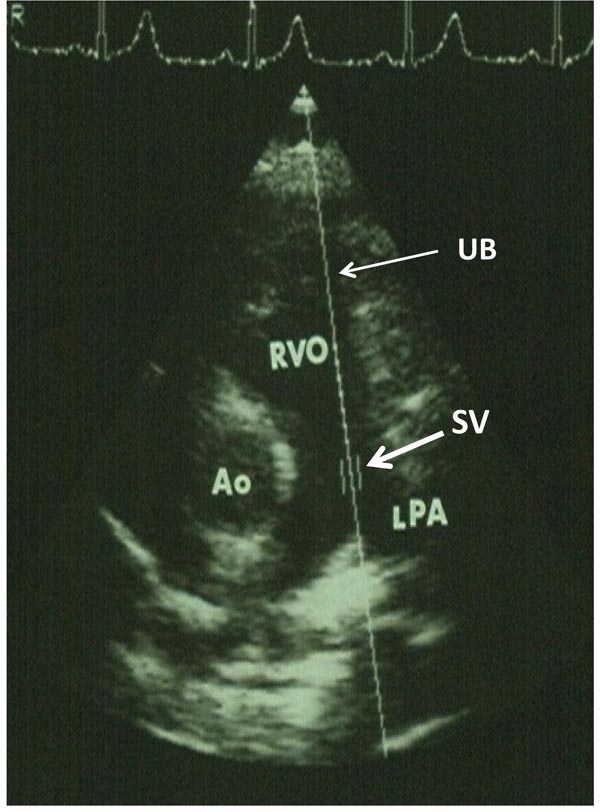
Figure 11.3. Parasternal short-axis view of the heart illustrating the position of the SV in the main pulmonary artery (thick arrow) along the UB (thin arrow). Ao, aorta; LPA, left pulmonary artery; RVO, right ventricular outflow tract.
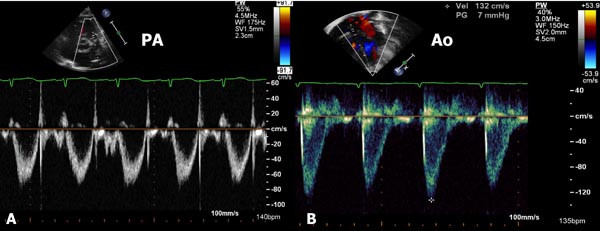
Figure 11.4. Parasternal short-axis view of the heart illustrating the position of the sample volume in the main pulmonary artery (A) and apical five-chamber view with the position of the sample volume in the AO (B). Bottom portions of both the panels show pulsed Doppler recordings; these are usually around 1.0 m/s.
CW Doppler uses 2 crystals, one crystal to continuously send ultrasound and the other to receive the reflected ultrasound. The advantage is that it can record high flow velocity. The disadvantage is that it records Doppler data along the line of the UB and the site of abnormal flow velocity cannot be localized. Combined use of pulsed Doppler and CW Doppler resolves this issue (Figure 11.5). Alternatively, HPRF Doppler may be utilized. In this technique, several pulsed ultrasound signals are in the body simultaneously; 3 or more sample volumes are placed along the UB. With appropriate placement of sample volumes at desired locations, the site of flow disturbance can be localized and quantitated (Figure 11.6). With both the CW and HPRF velocity, the UB should be 0° or 180° to the direction of flow in order to record the maximum (true) velocity. An angle of incidence up to 20° is acceptable with which the magnitude of velocity may be reduced only by 6%.
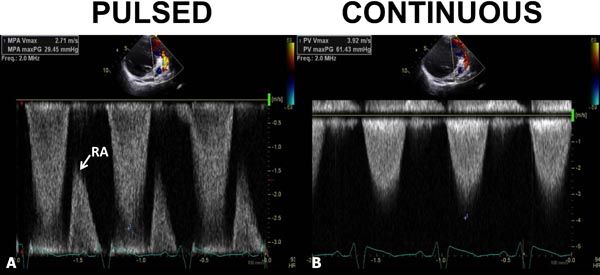
Figure 11.5. Pulsed- (A) and continuous-wave (B) Doppler recordings from the pulmonary artery. In A, the pulsed Doppler signal did not record the peak velocity; the maximum velocity recorded was only 2.71 m/s. A rap-around (RA) is seen. In B, continuous wave Doppler clearly demonstrated a peak velocity of 3.71 m/s. The inability of pulsed Doppler to record the maximum velocity is related to its low Nyquist limit with consequent aliasing.
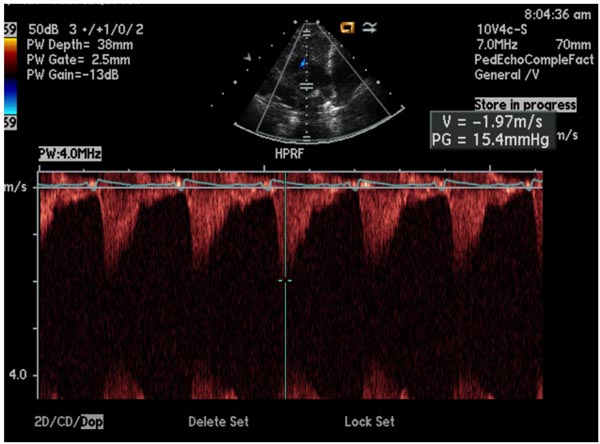
Figure 11.6. HPRF Doppler; note 3 sample volumes are placed along the ultrasound beam (insert).
In color Doppler (Figure 11.7), the velocities are color-coded so that the velocity of blood moving toward the transducer is red and the blood moving away from the transducer is blue. Turbulent flow is expressed in a mosaic pattern (Figure 11.8), which is a mixture of yellow and green superimposed on red and blue. In practice, varying combinations of color, pulsed, and CW or HPRF Doppler examination are used.
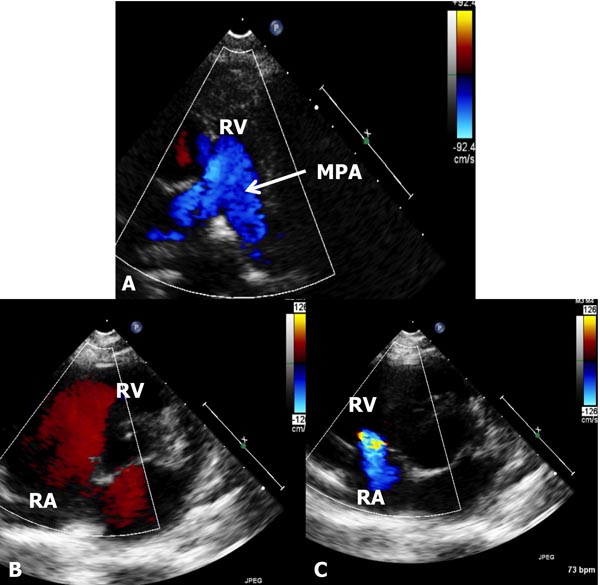
Figure 11.7. The figure shows 3 different echo-Doppler panels to demonstrate color Doppler. In A, the forward flow from the RV into the MPA is shown by blue flow (see the inset to the right). In B, the flow from the RA into the RV is red; see the inset to the right. Both indicate normal direction of flow in the cardiac chambers. In C, the flow is reversed from the RV to RA because of tricuspid insufficiency; again see the inset to the right. Thus, the color-coding of the Doppler helps the echocardiographer identify the direction of flow. Note that the flow is uniform and laminar (A and B) and does not indicate any flow disturbance.
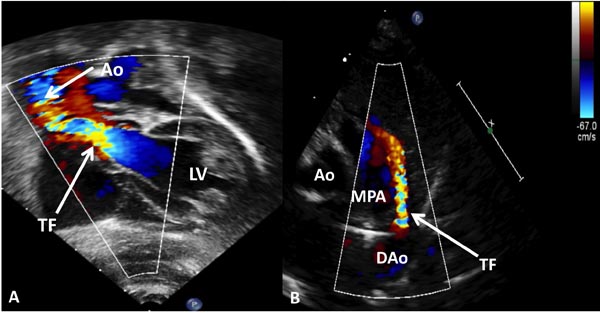
Figure 11.8. These figures illustrate turbulent flow. Panel A: In an infant with aortic stenosis, the turbulent flow (arrow) begins at the aortic valve level because of aortic stenosis. In panel B, the turbulence starts at the ductus (arrow—TF). AO, aorta; DAo, descending aorta; LV, left ventricle; MPA, main pulmonary artery.
The Doppler data as obtained above are useful in deriving hemodynamic information using the following principles. (1) If any Doppler jet velocity is recorded across any 2 chambers in the heart, that velocity (V) is proportional to the pressure difference between those 2 chambers. (2) The pressure difference between the chambers may be calculated using a modified Bernoulli equation (gradient = 4V²). (3) Arm-cuff systolic blood pressure (BP) may be used as an estimate of left ventricular (LV) peak systolic pressure provided no aortic stenosis is present. (4) Deductive reasoning may be applied based on the above assumptions and information available from clinical and echocardiographic data.
Echo Protocol
Echocardiograms are performed with the transducer positioned in the left parasternal, apical, subcostal, and suprasternal locations. Parasternal long (Figure 11.2) and short (Figure 11.9) axes, apical 4- and 5-chamber (Figure 11.10), subcostal (Figures 11.11 and 11.12), and suprasternal notch (Figures 11.13 and 11.14) views are routinely recorded.
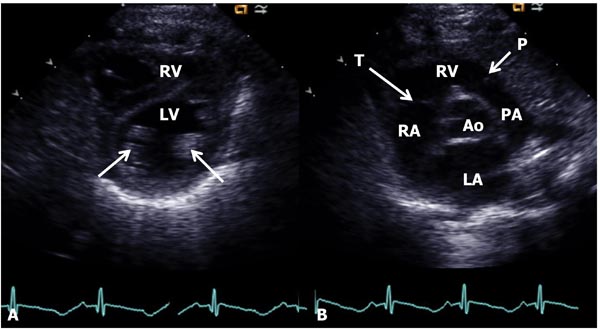
Figure 11.9. Parasternal short-axis view of the heart at the papillary muscle (arrows in A) level (A) and at the aortic valve level (B). In A, the LV is seen posteriorly with the RV anteriorly. In B, the AO is in the center with the LA posteriorly and RV anteriorly. The tricuspid (T) and pulmonary (P) valves (arrows) are shown as are the RA and PA.
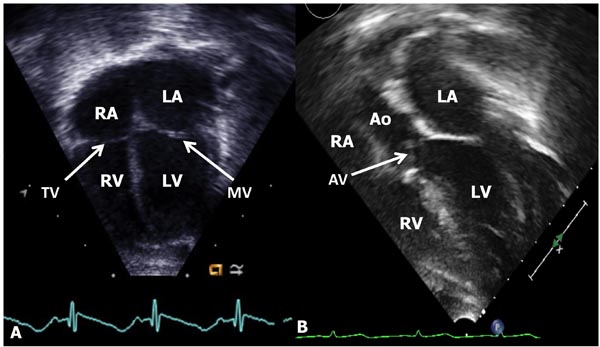
Figure 11.10. A: Apical four-chamber view of the heart showing the LA, LV, RA, and RV. The mitral (MV) and tricuspid (TV) valves (arrows) and atrial and ventricular septae (not marked) are seen. B: Apical 5-chamber view, in addition, demonstrates LVOT aortic valve (AV, arrow) and aorta (AO).
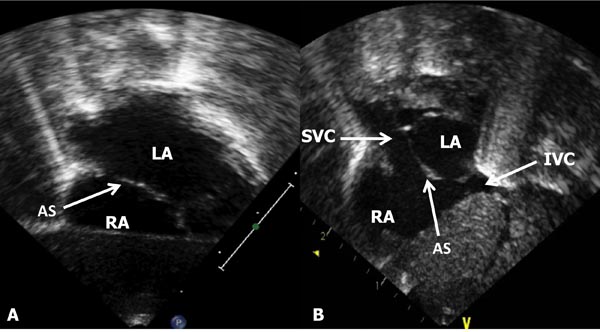
Figure 11.11. A: Subcostal long-axis view of the atrial septum (AS) demonstrating LA and RA. B: Subcostal short-axis view of the AS (arrow), in addition to the LA and RA, the SVC and IVC are shown.
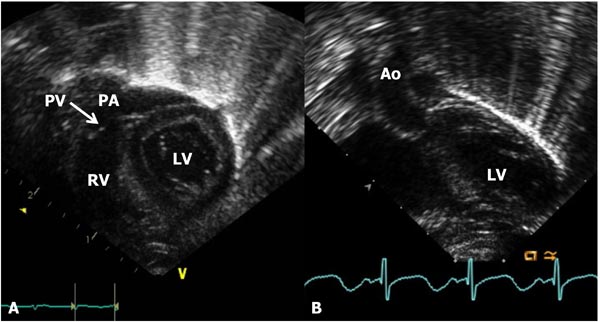
Figure 11.12. A: Subcostal long-axis view of the ventricles demonstrating the RV, pulmonary valve (PV), and the PA. The LV is seen posteriorly. B: Subcostal short-axis view of the LV and AO.
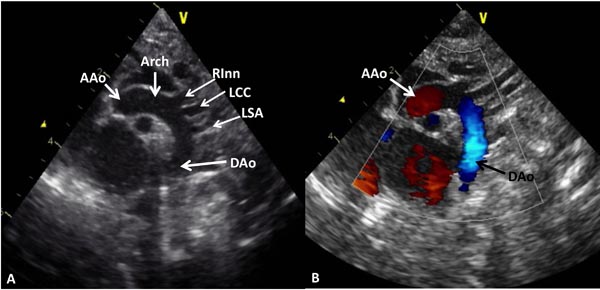
Figure 11.13. A: Suprasternal notch view of the aortic arch demonstrating the AAo, Arch and DAo. Note the origin of the right innominate (RInn), left common carotid (LCC) and left subclavian (LSA) arteries arising from the aortic arch. B: The same view with color Doppler imaging showing red flow in the AAo and blue flow in the DAo.
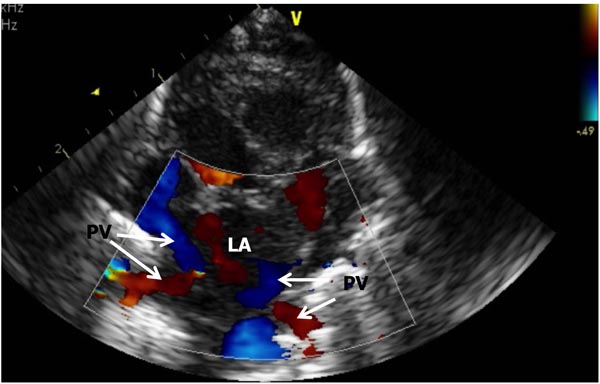
Figure 11.14. A. Suprasternal notch, crab-view of the pulmonary veins (PV) draining into the LA). Each of the PV is Doppler interrogated during any routine study and normal Doppler velocity recorded (not shown).
2D and, when necessary, M-mode recordings as well as color, pulsed, and CW or HPRF Doppler examination are performed routinely as deemed suitable. Doppler examination includes exploration of the atrial and ventricular septae for shunt, the right and left atria proximal to the atrioventricular (AV) valve to exclude AV valve insufficiency, the left (and right) ventricular inflow for excluding mitral (tricuspid) stenosis, the right ventricular outflow tracts (RVOT) and left ventricular outflow tracts (LVOT) for semilunar valve insufficiency, the pulmonary artery (PA) and the aorta for semilunar valve stenosis, coarctation of the aorta (CoA), and patent ductus arteriosus (PDA). Study of other locations depending on the clinical and echo findings may also be undertaken.
Distressed Babies with Noncardiac Causes-Normal Echo Studies
There are a number of neonates who are either cyanotic or have respiratory distress because of noncardiac causes, and these include persistent pulmonary hypertension, neonatal asphyxia, central nervous system disorders, polycythemia, methemoglobinemia, hypoglycemia, pulmonary (lung) hypoplasia, shock and sepsis, maternal drugs, and others. Similarly, babies who have either pulmonary parenchymal disease (hyaline membrane disease, aspiration syndrome, pneumonia, rare disorders such as pulmonary hemorrhage or Wilson–Mikety syndrome, broncho-pulmonary dysplasia) or diseases causing mechanical interference with lung function (diaphragmatic hernia, pneumothorax and pneumo-mediastinum, tracheo-esophageal fistula, and lobar emphysema) are also likely to have normal hearts. In these babies, echocardiographic studies can clearly demonstrate normal cardiac structure and function. In some cases incidental congenital heart disease (CHD) may be detected and needs to be addressed depending on its hemodynamic significance.
In some of these babies, the PA pressures are elevated and the echo-Doppler studies are very useful in estimating the PA pressures. Detection and quantification of elevated PA pressure are useful in making clinical management decisions; the echo-Doppler methods for such will be discussed in the next section. Some babies may have depressed LV function; this will also be reviewed in a subsequent section of this chapter.
Estimation of Elevated PA Pressure (Pulmonary Hypertension)
The PA pressures may be estimated with reasonable accuracy by echo-Doppler studies in the majority of babies. In the past, pulmonary valve (PV) pattern on M-mode echocardiogram, pre-ejection period (PEP) to right ventricular ejection time (RVET) ratio, PA flow curve pattern, and PA pulsatility index have been used to estimate the PA pressures, but are generally unreliable. If any Doppler jet is recorded in the right heart, that Doppler jet velocity (V) may be used to calculate the pressure difference between those2 chambers using a modified Bernoulli equation: Gradient = 4V2. Simultaneous recording of arm systolic BP is useful to quantitate the degree of elevation of the PA pressure. Table 11.2 lists the various formulas used in the calculation of physiological parameters and hopefully become helpful to the reader and for ready reference.
Table 11.2. Calculations/formulas described in the text
| Modified Bernoulli equation | Gradient = 4V2 where V is the Doppler jet velocity |
| Estimation of PAP in the presence of tricuspid insufficiency | PAP = RVP = 4V2 + 5 mmHg where PAP is the pulmonary artery systolic pressure, RVP the right ventricular systolic pressure, and V is regurgitant tricuspid jet velocity. The RA pressure is assumed to be 5 mmHg |
| Estimation of PAP in the presence of a VSD) | PAP = RVP = LVSP – 4V2 where PAP is the pulmonary artery systolic pressure, RVP the right ventricular systolic pressure, LVSP the left ventricular peak systolic pressure (systolic blood pressure), and V is the VSD jet velocity |
| Estimation of pulmonary artery diastolic pressure in the presence of pulmonary insufficiency | PA diastolic pressure = 4V2 + 5 where PA is the pulmonary artery and V is the pulmonary insufficiency jet velocity. |
| Estimation of pulmonary artery diastolic pressure in the presence of PDA | PA pressure = BP – 4V2 where PA is the pulmonary artery, BP arm blood pressure, and V is the PDA flow velocity |
| Left ventricular function by shortening fraction of the left ventricle | SF = [(LVIDd – LVIDs)/LVIDd] × 100 where SF is the shortening fraction, LVIDd is the left ventricular internal dimension in end-diastole, and LVIDs is the left ventricular internal dimension in end-systole |
| Left ventricular function by area shortening of the LV using Simpson’s rule | AS = (LVAd-LVAs)/LVAd where AS is area shortening, LVAd is the LV area in diastole, and LVAs is the LV area in systole. |
In the presence of tricuspid insufficiency (Figure 11.15), initially right ventricular outflow tract (RVOT) is interrogated to exclude pulmonary stenosis (PS). In the absence of PS, peak velocity of the regurgitant tricuspid jet (V) can be used to estimate the pulmonary artery systolic pressure (PAP)
PAP = RVP = 4V2 + 5 mmHg
where PAP is the pulmonary artery systolic pressure, RVP is the right ventricular systolic pressure, and V is regurgitant tricuspid jet velocity. The right atrial pressure is assumed to be 5 mmHg.
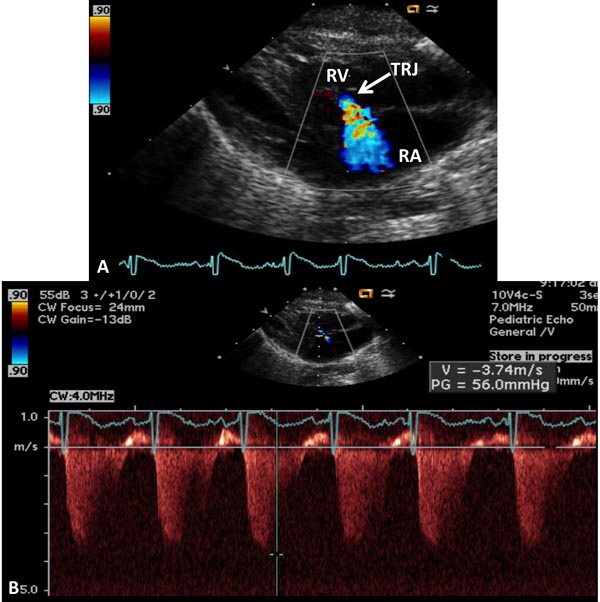
Figure 11.15. A: Precordial 2D and color Doppler recording to demonstrate tricuspid regurgitent jet (TRJ). B: Continuous-wave Doppler recording of TRJ, which is useful in the calculation of pulmonary artery systolic pressure; peak velocity of 3.74 indicates 56 mmHg gradient (by modified Bernoulli equation) across the tricuspid valve; to this an assumed right atrial (RA) pressure of 5 mmHg is added to calculate the PA pressure (see the text). RV, right ventricle.
In the presence of a ventricular septal defect (VSD), again, RVOT is interrogated to exclude PS and LVSP is estimated by arm-cuff BP after excluding the LV outflow tract obstruction. Doppler interrogation across VSD is performed, and if VSD flow velocity is <2.0 m/s (Figure 11.16), we can generally assume unrestrictive VSD:
PAP = RVP = LVSP,
where PAP is the pulmonary artery systolic pressure, RVP the right ventricular systolic pressure, and LVSP is the left ventricular peak systolic pressure (systolic BP).
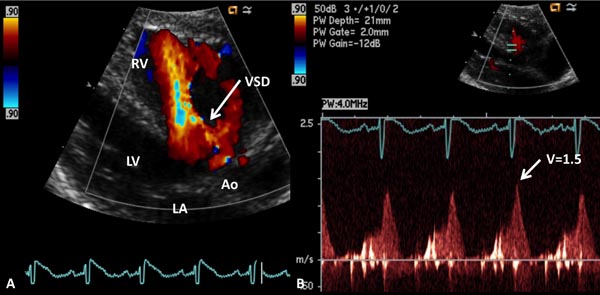
Figure 11.16. A: Precordial long-axis 2D and color Doppler recording showing a ventricular septal defect (VSD). B: Pulse Doppler recording across the VSD shows low velocity (1.5 m/s) suggesting that the PA pressure is markedly elevated (see text for details). Ao, aorta; LA, left atrium; LV, left ventricle RV, right ventricle.
If VSD flow velocity is >2.0 m/s (Figure 11.17), we generally assume that restrictive VSD and the PAP may be estimated thus:
PAP = RVP = LVSP – 4V2
where PAP is the pulmonary artery systolic pressure, RVP the right ventricular systolic pressure, LVSP the left ventricular peak systolic pressure (systolic BP), and V is VSD jet velocity.
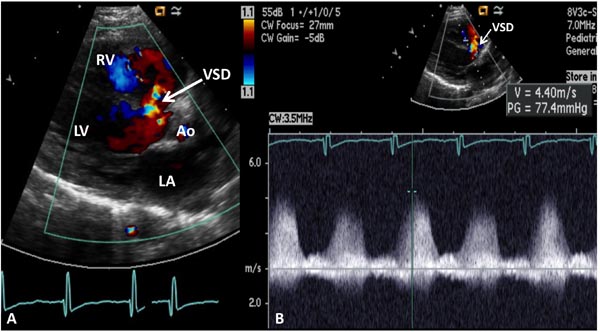
Figure 11.17. A: Precordial long-axis 2D and color Doppler recording showing a ventricular septal defect (VSD). B: Continuous-wave Doppler recording across the VSD shows high velocity (4.4 m/s) suggesting that the PA pressure is low (see text for details). Ao, aorta; LA, left atrium; LV, left ventricle RV, right ventricle.
If pulmonary insufficiency (Figure 11.18) is present, PA diastolic pressure may be estimated:
PA diastolic pressure = 4V2 + 5
where PA is the pulmonary artery and V is the pulmonary insufficiency jet velocity.
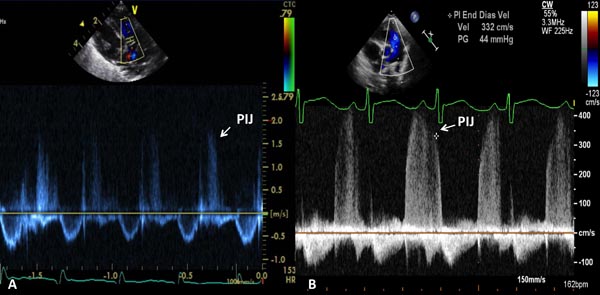
Figure 11.18. A. Precordial short-axis 2D and pulse Doppler recording showing pulmonary insufficiency jet (PIJ) which is low (1.6 m/s); this would suggest low PA pressure (see text for details). B. Precordial short-axis 2D and continuous-wave Doppler recording showing PIJ, which is high (3.3 m/s); this would suggest elevated PA pressure (see text for details).
If PDA is present, PA diastolic pressure may be estimated (Figures 11.19 and 11.20):
PA pressure = BP – 4V2
where PA is the pulmonary artery, BP the arm BP, and V is the PDA flow velocity.
A low PDA velocity (see Figure 11.19) suggests high PA pressure, and a high PDA velocity (see Figure 11.20) indicates low PA pressure.
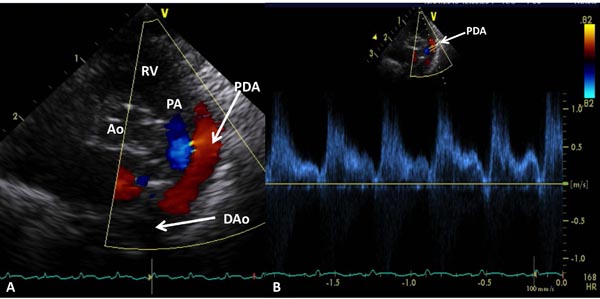
Figure 11.19. Precordial short-axis 2D and color Doppler recording (A) showing PDA with left-to-right shunt. Low Doppler velocity (B) across the PDA (1.0–1.4 m/s) suggests elevated PA pressure (see text for details). Ao, aorta; DAo, descending aorta; PA, pulmonary artery; RV, right ventricle.
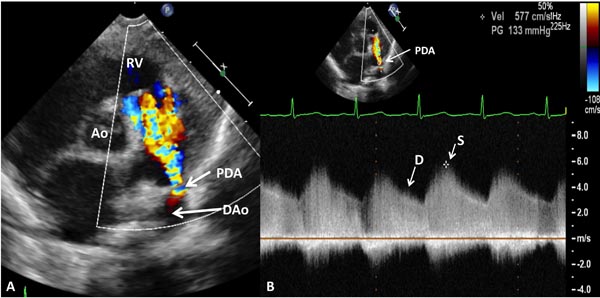
Figure 11.20. Precordial short-axis 2D and color Doppler recording (A) showing PDA with left-to-right shunt. High Doppler velocity (B) across the PDA (≈4 m/s) suggests low PA pressure (see text for details). Ao, aorta; D, diastolic; DAo, descending aorta; RV, right ventricle; S, systolic.
In the absence of Doppler jets in the right heart structures, indirect indicators such as right atrial enlargement, RV dilatation, RV hypertrophy, PA dilatation, and ventricular septal flattening may indicate elevated PA pressures, but the degree of elevation cannot be quantitated. Shorter acceleration times (<100 ms) and “spike and dome” pattern of the PA flow velocity curve may also suggest elevated PAP.
Left Ventricular Function
A number of echocardiographic techniques, such as PEP/LVET ratio, isovolumic contraction time, LV volumes by M-mode echo, velocity of circumferential shortening fraction (SF), LV SF, percent thickening of the LV posterior wall, LV posterior wall velocity, several measures of aortic and mitral valve opening and closing, and others8,9
Stay updated, free articles. Join our Telegram channel

Full access? Get Clinical Tree


