Fig. 4.1
Measurement of end-diastolic right ventricular wall thickness. (a) M-mode image of RV wall. (b) Subcostal 2D image of right ventricular wall. Arrows indicating wall thickness at end diastole
4.3.2 RV Linear Dimensions
The chronic RV volume and/or pressure overload and RV failure may result in RV dilation. Indexed RV end-diastolic diameter has been considered a predictor of survival in patients with chronic pulmonary disease. The RV dilation can be qualitatively or quantitatively evaluated using 2D echocardiography. In the normal heart, the RV should display smaller than the LV and usually no more than two thirds the size of the LV in the standard apical four-chamber view. If the RV is larger than the LV and/or equal to the size of the LV in this view, it is considered to be enlarged. However, the qualitative assessment is less accurate when LV dilation coexists. As the RV may displace the LV and occupy the apex, this usually suggests that the RV is at least moderately dilated. As the RV may be measured within the normal reference limits but appears larger than the LV, the RV should be regarded as dilated. The conventional apical four-chamber view focuses on LV and results in considerable variation in RV dimension in the same patient. RV dimensions are best measured from a RV-focused apical four-chamber view and ensure that the RV is not foreshortened and appears the largest basal RV diameter.
The RV basal and mid-diameters and the RV longitudinal dimension may be measured (Fig. 4.2). The RV basal, mid-cavity and longitudinal dimensions should be evaluated in patients with right-sided heart disease or pulmonary artery hypertension (PAH). The basal diameter is measured in the maximal dimension in the basal one third of the RV seen on the RV-focused apical four-chamber view. The mid-cavity diameter is defined as the middle third of the RV at the level of the LV papillary muscles. The longitudinal dimension is from the plane of the tricuspid annulus to the RV apex. A diameter >41 mm at the base and >35 mm at the midlevel in the RV-focused view indicates RV dilatation. Similarly, a longitudinal dimension >83 mm suggests RV enlargement [2].
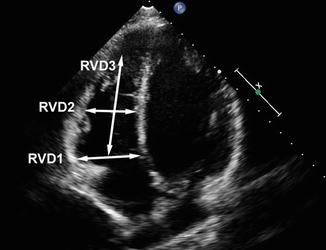

Fig. 4.2
The RV-focused apical four-chamber image showing the RV basal (RVD1) and mid-(RVD2) diameters and the RV longitudinal dimension (RVD3)
However, the RV linear dimension has limitations, so that it could not reflect the complex geometry of the RV. RV linear dimension is highly dependent on loading conditions, the quality of the images and the angle of the ultrasound beam. RV diameter measurement is also influenced by respiratory cycle. In addition, significant variation can be caused by image probe or patient position during examination. For example, measured RV diameter increases up to 40 % when rolling patient from supine to left lateral position.
4.3.3 Interventricular Septal Morphology and Eccentricity Index
When there is RV pressure or volume overload, septum displaces towards the LV and flattens, and LV cavity becomes “D” shaped. The pattern of septum movement in systole and diastole can distinguish between volume overload and pressure overload. In case of RV volume overload, the flattening of the septum is seen only in diastole. When there is RV pressure overload, septum flattening occurs during the entire cardiac cycle with most marked distortion of the left ventricle at end systole. Eccentricity index (EI) is an index of RV overload. EI, defined as the ratio of the LV anteroposterior to septolateral diameters in the short-axis view, can be measured at both end systole and end diastole. Normal individuals have a value of 1 in both time points. A value greater than 1 is abnormal and suggests RV overload. The pattern of displayed movement by the septum can predict the clinical and hemodynamic status in patients with PAH. A higher EI is an important predictor of mortality in PAH. The values of EI are influenced by the measurement in different LV short-axial views. Apical level EI has been shown to correlate better with worsening PAH severity, RV cavity dilation and RV systolic dysfunction when compared with mitral valve and papillary muscle levels EI. Identifying end systole and end diastole can also affect the measurements of EI. Analysis of septal motion is best performed in the absence of significant conduction delays, particularly left bundle branch block [3–6].
4.3.4 RV Systolic Function
The RV has two-layer muscle fibres: superficial circumferential muscle fibres responsible for its inward movement and inner longitudinal fibres that result in the longitudinal contraction. The longitudinal shortening plays a greater role in RV emptying compared with the left ventricle. RV systolic function should be assessed using multiple parameters, including RIMP, TAPSE, 2D FAC, 3DE-derived EF, S′ and longitudinal strain and strain rate by DTI and 2D STE. Multiple studies have verified the clinical utility and value of RIMP, TAPSE, 2D FAC and S′ of the tricuspid annulus, as well as longitudinal speckle-tracking echocardiographic strain. 3DE-based RV EF appears to be more reliable and better reproducible when properly performed. Global assessment of RV function includes the myocardial performance index (MPI), RV dP/dt, RV EF and FAC. Regional parameters include tissue Doppler-derived systolic velocities of the annulus (S) and TAPSE and TDI-derived and speckle-tracking strain and strain rate. Each method is affected by the respective limitations.
4.4 Global Right Ventricular Function
4.4.1 RV Volume and Ejection Fraction by 2D Echocardiography
RV dysfunction is the independent predictor of unfavourable prognosis in patients with heart failure and has been also described as the determinant of long-term survival and the independent predictor of poor clinical status in patients with repaired TOF [7]. In clinical practice, probably the most commonly used parameters of RV size and contractile function are RV volumes and RV ejection fraction (EF). Although widely accepted, RVEF is highly dependent on loading conditions. The 2D echocardiographic methods of measuring RVEF include area-length methods, disc summation methods and other methods. The area-length methods require geometric assumption, most commonly based on modified pyramidal or ellipsoidal models. The disc summation method mainly determines an RV “body” volume, using the apical four-chamber view. RV volumes are therefore underestimated because it excludes the infundibulum that accounts for as much as 25–30 % of RV volume. RV EF from 2D methods is calculated as (end-diastolic volume—end-systolic volume)/end-diastolic volume. RVEF can vary from 40 to76 % depending on the type of modality used. Currently, MRI is the gold standard for calculating RV volumes and EF. The normal value of MRI-derived RVEF is 61 ± 7 %, ranging from 47 to 76 %. The 2D echocardiographic methods of assessing RV volume and RVEF are less accurate because of the complex geometry of RV. The correlation between RVEF by echocardiography and MRI-determined RVEF is weak to moderate in normal individuals (r = 0.15–0.54), in pulmonary embolism and repaired TOF (r = 0.33–0.61) and myocardial infarction and atrial septal defect (r = 0.32–0.85) [8, 9]. Therefore, based on the guideline for the echocardiographic assessment of the right heart published in 2010 by the ASE and the EACVI, 2D-derived assessment of RV EF is not recommended because of the heterogeneity of methods and the geometric assumptions [1].
4.4.2 Right Ventricular Fractional Area Change
Right ventricular fractional area change (RVFAC) is defined as (RV end-diastolic area—RV end-systolic area)/RV end-diastolic area. The RVFAC is a simple and independent of geometric assumption method of assessing RV function. RVFAC has been shown to have prognostic significance in patients with myocardial infarction, pulmonary embolism and PH [10]. FAC is obtained in the apical four-chamber view by tracing the RV endocardium both in systole and diastole from the annulus, along the RV free wall to the apex and then along the interventricular septum back to the annulus (Fig. 4.3). It is important that the entire RV should be contained in the imaging, including the apex and the RV free wall, during both systole and diastole. Care must be taken to trace the free wall beneath the trabeculations. Compared with other 2D echocardiographic measures of RV systolic function [including tricuspid annular plane systolic excursion (TAPSE, r = 0.17) and transversal fractional shortening (r = 0.12)], RVFAC was best correlated with CMR-derived EF (r = 0.80). Accurately tracing RV systolic and diastolic endocardial border is an important factor that impacts on measuring RVFAC. Suboptimal RV endocardial definition limits the accuracy and reproducibility of RVFAC [11]. Based on the guideline for the echocardiographic assessment of the right heart published in 2010 and recommendations for echocardiographic chamber quantification published in 2015 by the ASE and the EACVI, two-dimensional RVFAC is one of the recommended methods of estimating RV function. RV FAC <35 % indicates RV systolic dysfunction [1, 2].
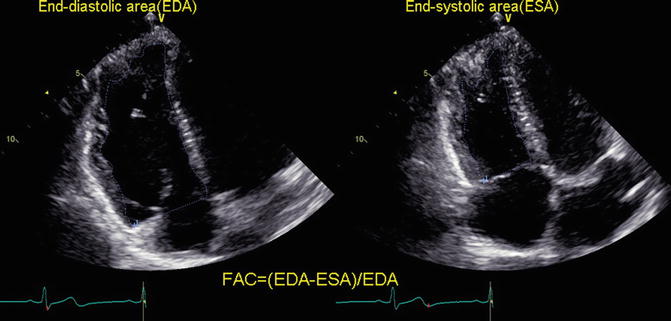

Fig. 4.3
Measurement of right ventricular fractional area change (FAC)
4.4.3 RV dP/dt
The rate of pressure rise in the ventricles (dP/dt) is also used as an index of ventricular contractility or systolic function. RV dP/dt can be measured on the ascending limb of the TR continuous-wave Doppler signal. It is commonly calculated by measuring the time required for the TR jet to increase in velocity from 1 to 2 m/s. Using the simplified Bernoulli equation, this represents a 12 mmHg increase in pressure. RV dP/dt is therefore calculated as 12 mmHg divided by this time (in seconds). Although the time from 1 to 2 m/s is most commonly used, the best correlation between echocardiographic and invasive measures was found by using the time from 0.5 to 2 m/s. RV dP/dt is load dependent. It will be less accurate in severe tricuspid regurgitation. Based on the guideline for the echocardiographic assessment of right heart published in 2010 by the ASE and the EACVI, RV dP/dt cannot be recommended for routine uses. It can be used in patients with suspected RV dysfunction. RV dP/dt < approximately 400 mmHg/s is likely abnormal [1, 2].
4.4.4 Myocardial Performance Index or Tei Index
Myocardial performance index (MPI), also known as the RIMP or Tei index, is defined as the ratio of sum of isovolumic contraction time (IVCT) and isovolumic relaxation time (IVRT) divided by ejection time (ET) or [(IVRT + IVCT)/ET]. It is an index of RV global performance, incorporating both measures of systolic and diastolic function [12]. The MPI increases in cases of RV dysfunction. The MPI can be obtained by two methods: the pulsed Doppler method and the tissue Doppler method [13, 14]. In the pulsed Doppler method, time intervals can be determined from two different cardiac beats. The ejection time can be obtained from the pulsed Doppler of RV outflow (time from the onset to the cessation of flow), while isovolumic intervals are determined based on the tricuspid flow. The tricuspid (valve) closure-opening (TCO) time is measured with either pulsed Doppler of the tricuspid inflow (time from the end of the transtricuspid A wave to the beginning of the transtricuspid E wave) or continuous Doppler of the TR jet (time from the onset to the cessation of the TR jet) (Fig. 4.4a). TCO time includes isovolumic contraction time, ejection time and isovolumic relaxation time. In the tissue Doppler method, the ejection time (time from the onset to the cessation of the S′ wave) and TCO time (time from the end of the A′ wave to the beginning of the E′ wave) can be measured from a single beat by pulsing the tricuspid annulus. The MPI has shown to be a predictor of poor prognosis in disease associated with PAH [15]. Its prognostic value was also demonstrated in congenital heart disease, myocardial infarction, hypertrophic cardiomyopathy, dilated cardiomyopathy and chronic respiratory diseases [15–17]. Chockalingam et al. demonstrated that RV MRI has high sensitivity (82 %) and specificity (95 %) for the diagnosis of RV myocardial infarction and decreased after thrombolysis [12]. An advantage is that MPI is independent of loading conditions, heart rate and geometric assumptions. Moreover, the MPI is a feasible and reproducible parameter of RV global performance. The MPI has been demonstrated to be unreliable when time intervals were obtained from different R-R intervals, as in atrial fibrillation. In addition, it is subjected to pseudonormalization due to a shortened isovolumic relaxation time when RA pressure is elevated (such as RV myocardial infarction). The MPI may be used for initial and serial assessment of RV function in complement with other quantitative and nonquantitative measurement as shown by the recommendations for echocardiographic chamber quantification published in 2015 by the ASE and the EACVI [2]. The upper reference limit is 0.43 using the pulsed Doppler method and 0.54 using the tissue Doppler method.
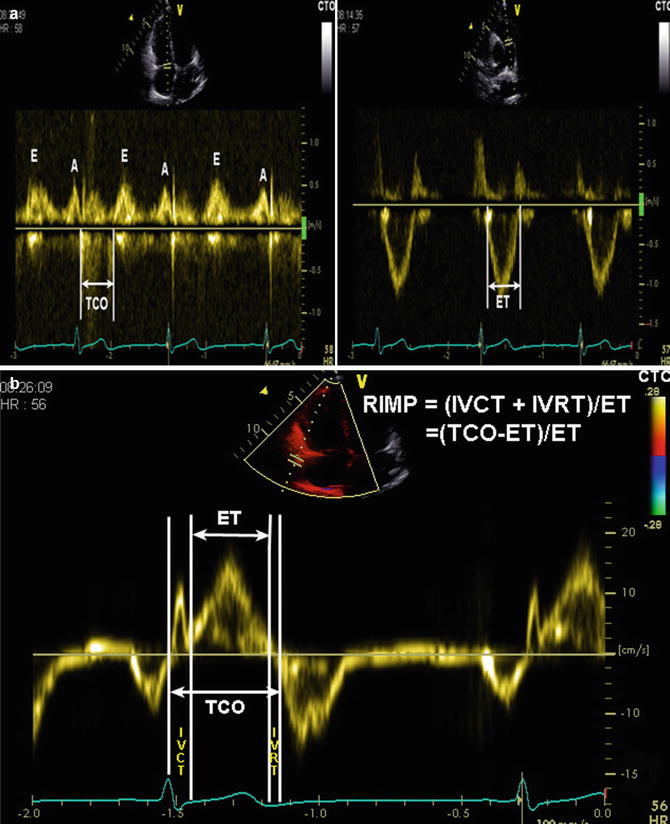

Fig. 4.4
Measurement of RV myocardial performance index (MPI) or RIMP by pulsed Doppler (a) and pulsed tissue Doppler (b). The tricuspid (valve) closure-opening (TCO) time encompasses isovolumic contraction time (IVCT), ejection time (ET) and isovolumic relaxation time (IVRT). RIMP = (TCO−ET)/ET
4.4.5 3D Echocardiography
The complex anatomy of RV is clearly displayed using 3D reconstruction techniques. Therefore, the quantification of RV volume and function for clinical use may represent the most justified application of three-dimensional echocardiography (3DE), as the awareness of two-dimensional echocardiography (2DE) shortcomings in this regard and the advancements in ultrasound technology are fastly growing. However, the clinical application of the conventional 3DE is limited due to time-consuming images acquirement and data analysis. The recent introduction of real-time three-dimensional echocardiography (RT3DE) offered a great progress in echocardiography as images may be obtained in just one beat. Good correlation between RT3DE and CMR for measuring RV volumes and EF was reported [18, 19]. RT3DE-determined RVEF correlated well with RVEF measured by radionuclide techniques [20]. The accuracy of RV volumes on 3DE has been validated against animal specimens, animal models of the RV and human intraoperative RV volume measurement. Compared with CMR data, RV volumes obtained from 3DE showed significantly better agreement and lower intra- and interobserver variability than 2DE.
During analysis of RV volume, it is important to manually define end-diastolic and end-systolic frames using maximal and minimal RV volumes, respectively. The moderator band and myocardial trabeculae should be included in the cavity (Fig. 4.5).
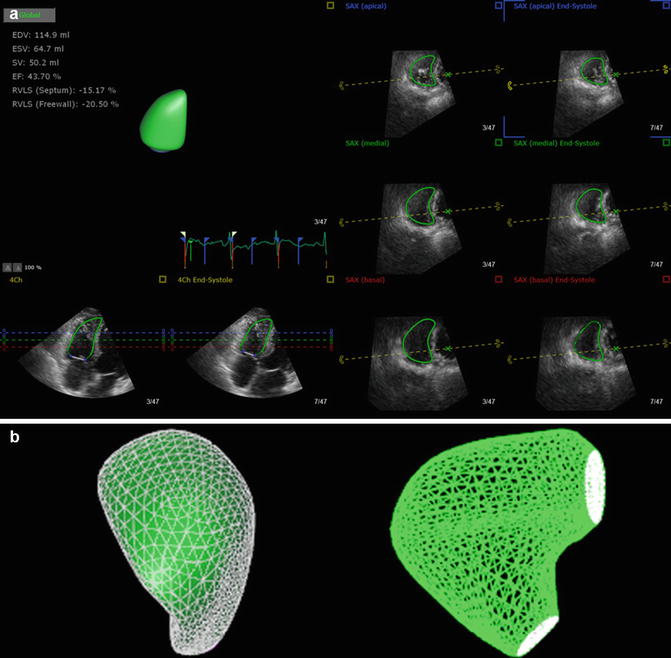

Fig. 4.5
Three-dimensional echocardiographic analysis of the right ventricle (RV). (a) The RV endocardial surface is semiautomatically traced. (b) The generated 3D model of the RV
RT3DE not only can adequately assess RV function in the subset of PH patients, but also enables unique views to outline and better understand particular causes of PH, such as septal defects or complex congenital pathology. RT3DE also provides new insight into mechanisms of tricuspid valve regurgitation in patients with hypoplastic left heart syndrome. The feasibility and usefulness of RT3DE for RV quantitation have also been demonstrated in patients with arrhythmogenic right ventricular dysplasia and congenital heart disease. Images may be obtained by transesophageal echocardiography (TTE) and transthoracic echocardiography (TEE). The accuracy of TTE-3D was comparable to that of TEE-3D. RT3DE seems to be superior to conventional 2DE owing to accurate volume analysis independent of RV size and shape, without foreshortened views and geometric assumptions. The drawbacks of this method include patient’s inability to cooperate for breathhold, arrhythmias, the larger footprint and size of matrix-array transducer and dependence on optimal acoustic quality [21–26]. 3DE-obtained RV volume and EF should be recommended in laboratories with appropriate 3D platforms and experience, and an RV EF of <45 % usually suggested abnormal RV systolic function. Current data indicate that the upper reference limit for RV EDV is 87 mL/m2 in men and 74 mL/m2 in women and for RV ESV is 44 mL/m2 for men and 36 mL/m2 for women [2].
4.5 Regional Right Ventricular Function
4.5.1 Tricuspid Annular Plane Systolic Excursion (TAPSE)
TAPSE is a method to obtain the systolic excursion of the RV annular segment along its longitudinal plane, from the standard apical four-chamber view by placing an M-mode cursor through the tricuspid lateral annulus and measuring the peak excursion of longitudinal motion of the annulus at systole (Fig. 4.6). It represents RV longitudinal function. This index assumes that the displacement of the basal segments in the apical four-chamber view is representative of the entire RV function, which can be invalid when regional RV wall motion abnormalities exist; otherwise, it has been shown to have a good correlation with RVEF assessed by radionuclide angiography. TAPSE is related to RV-decreased systolic function in patients with acute pulmonary embolism and a predictive factor in patients with heart failure and PAH. Although TAPSE is simple, widely available and reproducible and does not require geometric assumption, it is angle dependent. TAPSE only assesses longitudinal motion of RV basal segment and does not represent the complex motion of the entire RV. Moreover, TAPSE takes no account of the outlet and the septal contribution to RV ejection, which is also important to maintain overall RV function. Because of load dependency, TAPSE may be less accurately representative of RV systolic function in case of significant tricuspid regurgitation [26–28]. Nevertheless, TAPSE should be used routinely as a simple method of estimating RV function. TAPSE < 17 mm indicates RV systolic dysfunction [2].
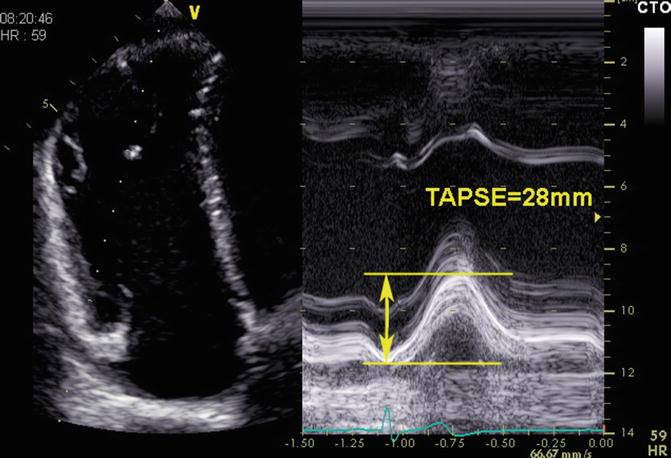

Fig. 4.6
Measurement of tricuspid annular plane systolic excursion (TAPSE)
4.5.2 Tissue Doppler Imaging (TDI)
4.5.2.1 Myocardial Velocity
TDI allows quantitative evaluation of RV systolic and diastolic function by measuring myocardial velocity. Myocardial systolic velocity (S′), obtained by pulsed TDI as well as colour-coded TDI, is a relatively simple and reproducible index of RV systolic function. The earlier studies used pulsed-wave TDI to evaluate RV function. Colour-coded TDI allows an offline analysis of several myocardial segments simultaneously during the same cardiac cycle. S′ by pulsed TDI and by colour-coded TDI cannot be used interchangeably, since the former measures peak myocardial velocities, whereas the latter measures mean myocardial velocities, which are 20 % lower. The most reliably and reproducibly imaged regions of the RV are the tricuspid annulus and the basal free wall segment. The pulsed TDI sample volume is placed in either the tricuspid lateral annulus or the basal segment of the RV free wall in the apical four-chamber view (Fig. 4.7). S′ < 11.5 cm/s identifies RV systolic dysfunction (RVEF < 45 %) with a sensitivity of 90 % and a specificity of 85 %. Moreover, S′ has been demonstrated to correlate with RVEF obtained from radionuclide techniques (r = 0.648) [29]. Sade et al. found that S′ was related to MRI-determined RVEF (r = 0.74) [30]. De Castro et al. observed that an S′ cut-off value of 9.5 cm/s yields significantly high sensitivity and specificity in identifying RV dysfunction in patients with PAH [27]. They also showed that S′ had a significant correlation with RT3DE-derived RVEF (r = 0.66). Myocardial velocity calculated by TDI for RV function assessment has been widely observed in patients with chronic obstructive pulmonary disease, scleroderma, obstructive sleep apnea syndrome, LV failure and RV myocardial infarction. Pulsed tissue Doppler is a simple and reproducible technique with good discriminative ability between normal and abnormal RV function. TDI is angle dependent. TDI-derived velocities may also be affected by overall cardiac motion and by tethering of the adjacent segments. Moreover, it assumes that the function of a single segment represents the entire RV function. Based on recommendations for echocardiographic chamber quantification published in 2015 by the ASE and the EACVI, S′ by pulsed TDI should be used in the estimate of RV function. S′ < 9.5 cm/s is considered abnormal RV function.
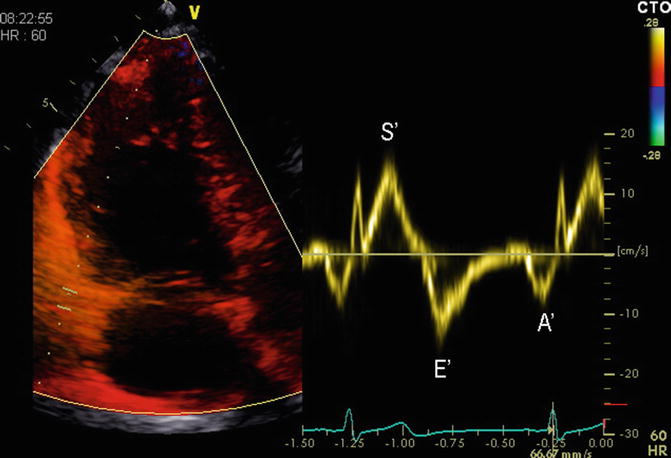

Fig. 4.7
Measurement of myocardial systolic velocity (S′) by pulsed tissue Doppler of the tricuspid annulus
4.5.2.2 RV Strain and Strain Rate
Strain (S) is defined as percentage change in myocardial deformation. Strain/strain rate (S/SR) represents deformation and deformation rate, respectively. In systole, S will have a negative value for longitudinal or circumferential shortening and a positive value for radial thickening. End-systolic S has been demonstrated to correlate well with EF. Strain appears to be load dependent, which increases with volume load. SR is shown to be less load dependent and appears to be an index of RV systolic performance. Strain and strain rates are thus useful parameters for assessing RV global and regional systolic function. Echocardiographic measurement of strain can be obtained by three methods: TDI method (1D strain), 2D speckle-tracking imaging (2D strain) and 3D speckle-tracking imaging (3D strain).
4.5.2.3 TDI-Derived Strain and Strain Rate (1D Strain)
TDI-derived strain and strain rates are measured in the apical four-chamber view (Fig. 4.8). Care should be taken to align the segment in the centre of the sector to avoid errors due to the angle dependence of TDI. A maximum tolerance of 10–15° off the axis of contraction is recommended. Imaging is in colour-coded TDI, and ≥3 beats are acquired with suspended respiration. To measure strain, high frame rates (≥100 frames/s) are required, ideally ≥150 frames/s. TDI-determined strain has been demonstrated to correlate well with strain by sonomicrometry in animal experiment (r = 0.92) [31]. Comparisons between myocardial strains by TDI and tagged MRI in healthy individuals, in infarct patients, and during stress echo showed excellent correlations [32, 33].
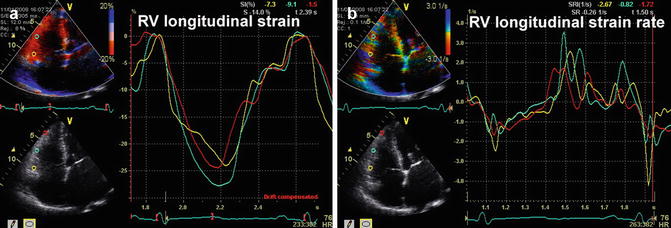

Fig. 4.8
Measurement of longitudinal strain and strain rate of RV free wall by tissue Doppler (TDI). (a) The strain curves of RV free wall. (b) The strain rate curves of RV free wall
Longitudinal strain and strain rate parameters of RV function have been validated in the clinical and animal experiment. In the normal subjects, longitudinal strain and strain rates of RV free wall increase from basal to apical segments. Pettersen et al. [34] found a shift in the RV free wall from longitudinal to circumferential shortening in the systemic RV when compared with the normal RV. In contrast, longitudinal shortening is predominant in the normal RV. Therefore, the contraction pattern of systemic RV resembles that of the normal LV, but without the ventricular torsion. TDI-derived S and SR were used to assess RV function in patients with PAH. Longitudinal deformation values of RV free wall were lower in the PAH population when compared with normal controls; furthermore, decreased strain values had been demonstrated to correlate strongly with pulmonary arterial pressure and pulmonary vascular resistance [35]. Mid-RV free wall is hypokinetic, whereas basal and apical segment appears normal motion in patients with pulmonary embolism. Thus, TDI-derived strain values in the mid-segment of RV free wall initially decreased and gradually normalized during the follow-up after thrombolysis.
Stay updated, free articles. Join our Telegram channel

Full access? Get Clinical Tree


