Note the date and time the ECG was taken
3. Calculate the heart rate
Rule of 300 (divide 300 by the number of large squares between two R waves)
Ten second rule (multiply the number of QRS complexes present in a 10 second ECG strip by 6)
4. Assess the rhythm
Each P is followed by a QRS complex and a T wave
The distance between each subsequent QRS complex should be roughly similar
5. Assess the cardiac axis
QRS complexes should be positive in leads I, II and aVF
RAD if lead I is negative but leads II and aVF are positive
LAD if lead I is positive but leads II and aVF are negative
6. Review individual waveform morphology
Assess P waves for:
P pulmonale – right atrial hypertrophy
P mitrale – left atrial hypertrophy
Absent P – atrial fibrillation
Assess PR interval for prolonged or shortened PR interval
Assess QRS complexes for:
Tall QRS complexes – left ventricular hypertrophy
Normal R wave progression
Bundle branch block
Assess Q waves for deep pathological Q waves which indicates a previous myocardial infarction
Assess ST segment for:
ST elevation – myocardial infarction, pericarditis
ST depression – myocardial infarction or ischaemia, digoxin
Assess QT interval for:
Long QT – electrolyte abnormalities, congenital long QT, drugs
Short QT – hypercalcaemia, congenital short QT, digoxin
Assess T wave for:
Peaked T – hyperkalaemia
Flattened T – hypokalaemia
T inversion – MI or ischaemia, bundle branch block
Assess U wave for:
Prominent U waves – bradycardia, hypokalaemia, digoxin
Inverted U waves – coronary artery disease
7. Localise the lesion
Review the abnormalities seen in the leads in relation to the area they represent:
V1, V2 – anterior wall of right ventricle; posterior wall (reciprocal waves)
V3, V4 – anteroseptal wall and anterior wall of left ventricle
V5, V6, I, aVL – lateral wall
II, III, aVF – inferior wall
4.2 Definition
An electrocardiogram (ECG) is the graphical interpretation of the electrical activity (voltage against time) of the heart during the cardiac cycle.
4.3 The 12-lead ECG
- The 12-lead ECG uses ten electrodes
- The ECG looks at the heart from multiple angles. The lead indicates the direction of the angle. The ten electrodes, producing ‘twelve leads’, are placed on extremities and on the chest generating 12 different ‘views’ of the heart:
- four electrodes on the extremities produce six limb leads (I, II, III, aVF, aVL, aVR)
- six electrodes on the precordium produce six precordial leads (V1, V2, V3, V4, V5, V6).
- four electrodes on the extremities produce six limb leads (I, II, III, aVF, aVL, aVR)
4.3.1 Placement of electrodes
Limb electrodes can be placed either proximally or distally (Figure 4.1). If placed proximally on the upper limb, it must be placed proximally for the lower limbs as well and vice versa.
R: Right arm
L: Left arm
F: Left leg
N: Right leg (ground electrode)
V1 Right sternal edge, 4th intercostal space
V2 Left sternal edge, 4th intercostal space
V4 Left mid-clavicular line, 5th intercostal space
V3 Midway between V2 and V4
V5 Left anterior axillary line (or midway between V4 and V6)
V6 Left mid-axillary line
V5 and V6 should be in the same horizontal plane as V4.
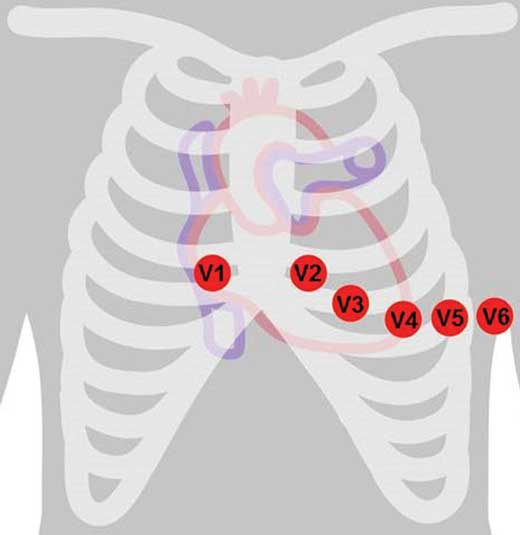
Figure 4.1 – Placement of chest electrodes.
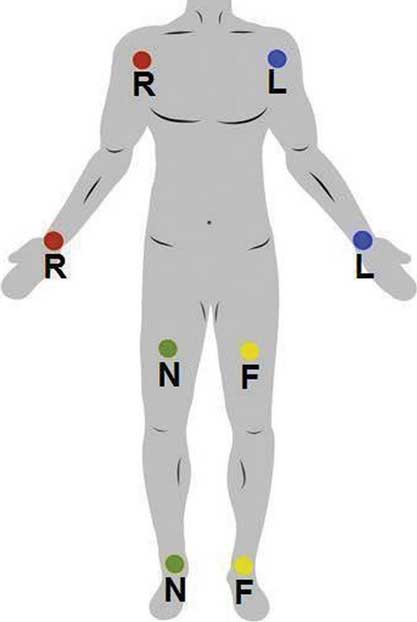
Figure 4.2 – Placement of limb electrodes.
4.4 Basic concepts
The contraction of any muscle is associated with electrical changes called ‘depolarisation’. ‘Repolarisation’ is the restoration of the electrical potential to its resting state.
- Wave of depolarisation towards the electrode produces a positive deflection
- Wave of depolarisation away from electrode produces a negative deflection
- Voltage calibration: two large vertical squares (10 mm) = 1 mV
- Paper speed: 25 mm/second
- One large horizontal square = 0.2 s, one small horizontal square = 0.04 s
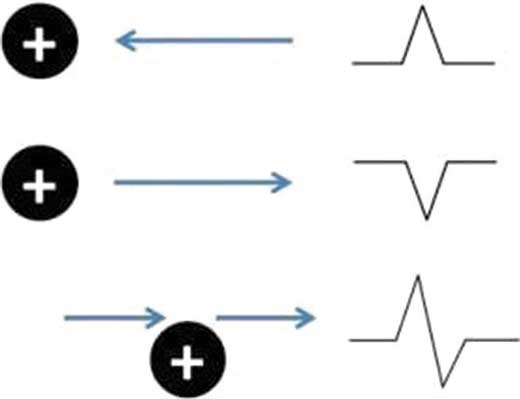
Figure 4.3 – Waves of depolarisation.
4.4.1 Waves
P wave: the first waveform in the ECG, reflects atrial depolarisation.
QRS complex: the subsequent waveform in the ECG, made up of three smaller deflections. The QRS complex reflects ventricular depolarisation with submerged atrial repolarisation.
- Q wave: the first negative deflection preceding the R wave
- R wave: the first positive deflection of the QRS complex, irrespective of the presence of a preceding Q wave
- S wave: any negative deflection after an R wave.
T wave: a positive deflection reflecting ventricular repolarisation.
U wave: These are very small deflections that occur immediately following a T wave.
U waves are usually absent.
// PRO-TIP //
There are four hypotheses on the mechanics of U waves:
- Repolarisation of the Purkinje fibres
- Delayed repolarisation of the papillary muscles
- After-potentials triggered by the mechanical forces in the ventricular wall
- Prolonged repolarisation of the mid-myocardium ‘M-cells’.
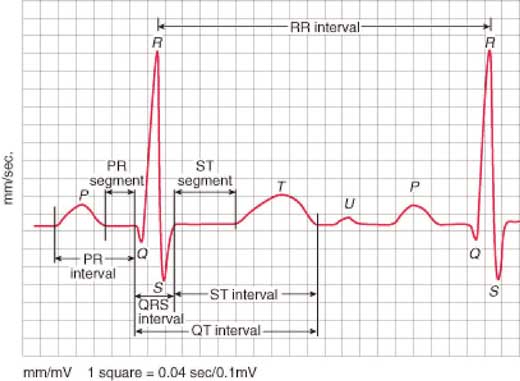
Figure 4.4 – Waves, segments and calibration.
4.4.2 Segments and intervals
An ECG segment is the period between the end of one wave and the beginning of the next wave. An interval contains one segment and at least one wave.
PR segment
- Starts at the end of a P wave and ends at the beginning of a Q wave
- Is usually flat and isoelectric.
EXAM | PR segment depression is an important ECG finding in pericarditis. |
Stay updated, free articles. Join our Telegram channel

Full access? Get Clinical Tree


