Care has been taken to confirm the accuracy of the information presented and to describe generally accepted practices. However, the authors, editors, and publisher are not responsible for errors or omissions or for any consequences from application of the information in this book and make no warranty, express or implied, with respect to the contents of the publication. This book should not be relied on apart from the advice of a qualified healthcare provider.
The authors, editors, and publisher have exerted every effort to ensure that drug selection and dosage set forth in this text are in accordance with current recommendations and practice at the time of publication. However, in view of ongoing research, changes in government regulations, and the constant flow of information relating to drug therapy and drug reactions, the reader is urged to check the package insert for each drug for any change in indications and dosage and for added warnings and precautions. This is particularly important when the recommended agent is a new or infrequently employed drug.
Some drugs and medical devices presented in this publication have U.S, Food and Drug Administration (FDA) clearance for limited use in restricted research settings. It is the responsibility of the health care provider to ascertain the FDA status of each drug or device planned for use in their clinical practice.
To purchase additional copies of this book, call our customer service department at (800) 638-3030 or fax orders to (301) 223-2320. International customers should call (301) 223-2300.
Visit Lippincott Williams & Wilkins on the Internet: at www.LWW.com. Lippincott Williams & Wilkins customer service representatives are available from 8:30 AM to 6:00 PM, EST.
10 9 8 7 6 5 4 3 2 1
Contents
Preface
The first two editions of Interpretation of Pulmonary Function Tests were well-received and met our goal of appealing to a wide, varied audience of health professionals. In this, the third edition, we have added a section to Chapter 7 on the forced oscillation technique for measuring respiratory system resistance, a procedure that has become popular in recent years. Other additions include a discussion in Chapter 5 of the measurement of exhaled nitric oxide, which is becoming useful in the study of asthma. The most recent guidelines (2005) on standardization of pulmonary function testing and interpretation published by the American Thoracic Society/European Respiratory Society Task Force have been added to Chapter 14.
Robert E. Hyatt, MD
Paul D. Scanlon, MD
Masao Nakamura, MD
Acknowledgments
We thank Patricia A. Muldrow for her secretarial contributions. We appreciate the assistance of the Division of Media Support Services in revising the illustrations. Without the help of LeAnn Stee, Jane M. Craig, Kenna Atherton, and Roberta Schwartz in the Section of Scientific Publications this book would not have reached fruition.
List of Abbreviations
| (A – a) DO2 | difference between the oxygen tensions of |
| alveolar gas and arterial blood | |
| BMI | body mass index |
| Cao2 | arterial oxygen-carrying capacity |
| Ccw | chest wall compliance |
| CL | compliance of the lung |
| CLdyn | dynamic compliance of the lung |
| CLstat | static compliance of the lung |
| COHb | carboxyhemoglobin |
| COPD | chronic obstructive pulmonary disease |
| Crs | static compliance of entire respiratory system |
| DL | diffusing capacity of the lungs |
| DLCO | diffusing capacity of carbon monoxide |
| DLO2 | diffusing capacity of oxygen |
| ERV | expiratory reserve volume |
| F | female |
| FEF | forced expiratory flow |
| FEFmax | maximal forced expiratory flow |
| FEF25 | forced expiratory flow after 25% of the FVC has been exhaled |
| FFE25-75 | forced expiratory flow over the middle 50% of the FVC |
| FEF50 | forced expiratory flow after 50% of the FVC has been exhaled |
| FEF75 | forced expiratory flow after 75% of the FVC has been exhaled |
| FEV1 | forced expiratory volume in 1 second |
| FEV6 | forced expiratory volume in 6 seconds |
| FEV1/FVC | ratio of FEV1 to the FVC |
| FIF50 | forced inspiratory flow after 50% of the VC has been inhaled |
| FIO2 | fraction of inspired oxygen |
| FRC | functional residual capacity |
| FV | flow-volume |
| FVC | forced expiratory vital capacity |
| Hb | hemoglobin |
| M | male |
| MetHb | methemoglobin |
| MFSR | maximal flow static recoil (curve) |
| MIF | maximal inspiratory flow |
| MVV | maximal voluntary ventilation |
| NO | nitric oxide |
| P | pressure |
| PaCo2 | arterial carbon dioxide tension |
| PACO2 | partial pressure of carbon dioxide in the alveoli |
| Palv | alveolar pressure |
| Pao | pressure at the mouth |
| Pao2 | arterial oxygen tension |
| PAO2 | partial pressure of oxygen in the alveoli |
| Patm | atmospheric pressure |
| PCO2 | partial pressure of carbon dioxide |
| PEF | peak expiratory flow |
| PEmax | maximal expiratory pressure |
| PH2O | partial pressure of water |
| Plmax | maximal inspiratory pressure |
| PO2 | partial pressure of oxygen |
| Ppl | pleural pressure |
| Pst | lung static elastic recoil pressure |
| PTLC | lung recoil pressure at TLC |
| Ptr | pressure inside the trachea |
P O2 O2 | mixed venous oxygen tension |
 | perfusion |
| R | resistance |
| Raw | airway resistance |
| Rpulm | pulmonary resistance |
| RQ | respiratory quotient |
| RV | residual volume |
| SAD | small airway disease |
| SBDLCO | single-breath method for estimating DLCO |
| SBN2 | single-breath nitrogen (test) |
| SVC | slow vital capacity |
| TLC | total lung capacity |
| V | volume |
 | ventilation |
| VA | alveolar volume |
 A A | alveolar ventilation |
| VC | vital capacity |
 CO2 CO2 | carbon dioxide production |
| VD | dead space volume |
 E E | ventilation measured at the mouth |
 max max | maximal expiratory flow |
 O2 O2 | oxygen consumption |
 O2 max O2 max | maximal oxygen consumption |
 / / | ventilation-perfusion |
| VR | ventilatory reserve |
| VT | tidal volume |
1

Introduction
Pulmonary function tests can provide important clinical information, yet they are vastly underused. They are designed to identify and quantify defects and abnormalities in the function of the respiratory system and answer questions such as the following: How badly impaired is the patient’s lung function? Is airway obstruction present? How severe is it? Does it respond to bronchodilators? Is gas exchange impaired? Is diffusion of oxygen from alveoli to pulmonary capillary blood impaired? Is treatment helping the patient? How great is the surgical risk?
Pulmonary function tests can also answer other clinical questions: Is the patient’s dyspnea due to cardiac or pulmonary dysfunction? Does the patient with chronic cough have occult asthma? Is obesity impairing the patient’s pulmonary function? Is the patient’s dyspnea due to weakness of the respiratory muscles?
The tests alone, however, cannot be expected to lead to a clinical diagnosis of, for example, pulmonary fibrosis or emphysema. Test results must be evaluated in light of the history; physical examination; chest radiograph; computed tomogram scan, if available; and pertinent laboratory findings. Nevertheless, some test patterns strongly suggest the presence of certain conditions, such as pulmonary fibrosis. Also, the flow-volume loop associated with lesions of the trachea and upper airway is often so characteristic as to be nearly diagnostic of the presence of such a lesion (see Chapter 2).
As with any procedure, pulmonary function tests have shortcomings. There is some variability in the normal predicted values of various tests. In some studies, this variability is in part due to mixing asymptomatic smokers with nonsmokers in a “normal” population. Some variability also occurs among laboratories in the ways the tests are performed, the equipment is used, and the results are calculated.
This text assumes that the tests are performed accurately, and it focuses on their clinical significance. This approach is not to downplay the importance of the technician in obtaining accurate data. Procedures such as electrocardiography require relatively little technician training, especially with the new equipment that can detect errors such as faulty lead placement. And, of course, all the patient need do is lie still. In marked contrast is the considerable training required before a pulmonary function technician becomes proficient. With spirometry, for example, the patient must be exhorted to put forth maximal effort, and the technician must learn to detect submaximal effort. The patient is a very active participant in several of the tests that are discussed. Many of these tests have been likened to an athletic event—an apt analogy. In our experience, it takes several weeks of intense training before a technician becomes expert in administering common tests such as spirometry. If at all possible, the person interpreting the test results should undergo pulmonary function testing. Experiencing the tests is the best way to appreciate the challenges faced when administering the test to sick, often frightened patients.
However, the main problem with pulmonary function tests is that they are not ordered often enough. Population surveys generally document some abnormality in respiratory function in 5% to 20% of subjects studied. Chronic obstructive pulmonary disease (COPD) is currently the fourth leading cause of death in the United States. It causes more than 100,000 deaths per year. It is estimated that 16 million people in the United States have COPD. All too often the condition is not diagnosed until the disease is far advanced. In a significant number of cases, lung disease is still not being detected. If we are to make an impact on COPD, it needs to be detected in the early stage, at which point smoking cessation markedly reduces the likelihood of progression to severe COPD. Figure 1-1 shows the progression of a typical case of COPD. By the time dyspnea occurs, airway obstruction is moderately or severely advanced. Looked at differently, spirometry can detect airway obstruction in COPD 5 to 10 years before dyspnea occurs.
Nevertheless, few primary care physicians routinely order pulmonary function tests for their patients who smoke or for patients with mild to moderate dyspnea. For patients with dyspnea, however, in all likelihood the blood pressure has been checked and chest radiography and electrocardiography have been performed. We have seen patients who have had coronary angiography before simple spirometry identified the true cause of their dyspnea.
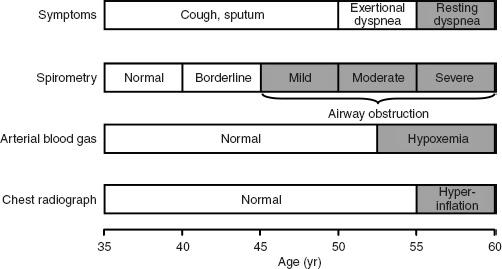
FIG. 1-1. Typical progression of the symptoms of chronic obstructive pulmonary disease (COPD). Only spirometry enables the detection of COPD years before shortness of breath develops. (From PL Enright, RE Hyatt [eds]: Office Spirometry: A Practical Guide to the Selection and Use of Spirometers. Philadelphia: Lea & Febiger, 1987. Used with permission of Mayo Foundation for Medical Education and Research.)
Why are so few pulmonary function tests done? It is our impression that a great many clinicians are uncomfortable interpreting the test results. They are not sure what the tests measure or what they mean, and, hence, the tests are not ordered. Unfortunately, very little time is devoted to this subject in medical school and in residency training. Furthermore, it is difficult to determine the practical clinical value of pulmonary function tests from currently available texts of pulmonary physiology and pulmonary function testing. The 2007 Joint Commission Disease-Specific Care program for the management of COPD may prompt primary care practitioners to adopt more sensitive and specific diagnostic methods.
The sole purpose of, and justification for, this text is to make pulmonary function tests user-friendly. The text targets the basic clinical utility of the most common tests, which also happen to be the most important. Interesting but more complex procedures that have a less important clinical role are left to the standard physiologic texts.
2

Spirometry: Dynamic Lung Volumes
Spirometry is used to measure the rate at which the lung changes volume during forced breathing maneuvers. The most commonly performed test uses the forced expiratory vital capacity (FVC) maneuver, in which the subject inhales maximally and then exhales as rapidly and completely as possible. Of all the tests considered in this book, the FVC test is both the simplest and the most important. Generally, it provides most of the information that is to be obtained from pulmonary function testing. It behooves the reader to have a thorough understanding of this procedure.
2A. SPIROGRAMS AND FLOW-VOLUME CURVE
The two methods of recording the FVC test are shown in Figure 2-1. In Figure 2-1 A, the subject blows into a spirometer that records the volume exhaled, which is plotted as a function of time, the solid line. This is the classic spirogram showing the time course of a 4-L FVC. Two of the most common measurements made from this curve are the forced expiratory volume in 1 second (FEV1) and the average forced expiratory flow rate over the middle 50% of the FVC (FEF25–75). These are discussed later in this chapter.
The FVC test can also be plotted as a flow-volume (FV) curve, as in Figure 2-1B. The subject again exhales forcefully into the spirometer through a flowmeter that measures the flow rate (in liters per second) at which the subject exhales. The volume and the rapidity at which the volume is exhaled (flow in liters per second) are plotted as the FV curve. Several of the common measurements made from this curve are discussed later in this chapter.
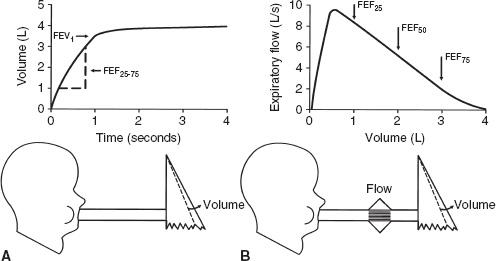
FIG. 2-1. The two ways to record the forced vital capacity (FVC) maneuver. A. Volume recorded as a function of time, the spirogram. FEV1, forced expiratory volume in 1 second; FEF25–75, average forced expiratory flow rate over the middle 50% of the FVC. B. Flow recorded as a function of volume exhaled, the flow-volume curve. FEF25(50,75), forced expiratory flow after 25% (50%, 75%) of the FVC has been exhaled.
The two curves reflect the same data, and a computerized spirometer can easily plot both curves with the subject exhaling through either a flowmeter or a volume recorder. Integration of flow provides volume, which, in turn, can be plotted as a function of time, and all the measurements shown in Figure 2-1 are also readily computed. Conversely, the volume signal can be differentiated with respect to time to determine flow. In our experience, the FV representation (Fig. 2-1B) is the easiest to interpret and the most informative. Therefore, we will use this representation almost exclusively.
Caution: It is extremely important that the subject be instructed and coached to perform the test properly. Expiration must be after a maximal inhalation, initiated as rapidly as possible, and continued with maximal effort until no more air can be expelled. “Good” and “bad” efforts are shown later on page 16 in Figure 2-6.
2B. VALUE OF THE FORCED EXPIRATORY VITAL CAPACITY TEST
The FVC test is the most important pulmonary function test for the following reason: For any given individual during expiration, there is a unique limit to the maximal flow that can be reached at any lung volume. This limit is reached with moderate expiratory efforts, and increasing the force used during expiration does not increase the flow. In Figure 2-1B, consider the maximal FV curve obtained from a normal subject during the FVC test. Once peak flow has been achieved, the rest of the curve defines the maximal flow that can be achieved at any lung volume. Thus, at FEF after 50% of the vital capacity has been exhaled (FEF50), the subject cannot exceed a flow of 5.2 L/s regardless of how hard he or she tries. Note that the maximal flow that can be achieved decreases in an orderly fashion as more air is exhaled (that is, as lung volume decreases) until at residual volume (4 L) no more air can be exhaled. The FVC test is powerful because there is a limit to maximal expiratory flow at all lung volumes after the first 10 to 15% of FVC has been exhaled. Each individual has a unique maximal expiratory FV curve. Because this curve defines a limit to flow, the curve is highly reproducible in a given subject. Most important, maximal flow is very sensitive to the most common diseases that affect the lung.
The basic physics and aerodynamics causing this flow-limiting behavior are not explained here. However, the concepts are illustrated in the simple lung model in Figure 2-2.
Figure 2-2A shows the lung at full inflation before a forced expiration. Figure 2-2B shows the lung during a forced expiration. As volume decreases, dynamic compression of the airway produces a critical narrowing that develops in the trachea and produces limitation of flow. As expiration continues and lung volume decreases even more, the narrowing migrates distally into the main bronchi and beyond. Three features of the model determine the maximal expiratory flow of the lung at any given lung volume: lung elasticity (e), which drives the flow and holds the airways open; size of the airways (f); and resistance to flow along these airways.
The great value of the FVC test is that it is very sensitive to diseases that alter the lung’s mechanical properties:
- In chronic obstructive pulmonary disease, emphysema causes a loss of lung tissue (alveoli are destroyed). This loss results in a loss of elastic recoil pressure, which is the driving pressure for maximal expiratory flow. Airways are narrowed because of loss of tethering of lung tissue. This results in increased flow resistance and decreased maximal expiratory flow.
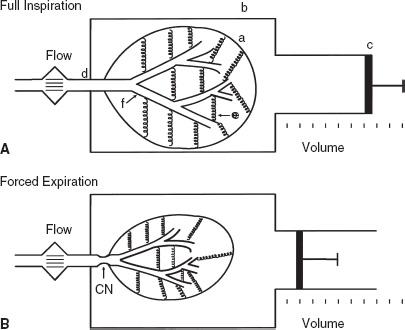
FIG. 2-2. Simple lung model at full inflation (A) and during a forced deflation (B). The lung (a) is contained in a thorax (b) whose volume can be changed by the piston (c). Air exits from the lung via the trachea (d). The lung has elasticity (e), which both drives the flow and plays a role in holding the compliant bronchi (f) open. Critical narrowing (CN) occurs during the FVC maneuver.
- In chronic bronchitis, both mucosal thickening and thick secretions in the airways lead to airway narrowing, increased resistance to flow, and decreased maximal flow.
- In asthma, the airways are narrowed as a result of bronchoconstriction and mucosal inflammation and edema. This narrowing increases resistance and decreases maximal flow.
- In pulmonary fibrosis, the increased tissue elasticity may distend the airways and increase maximal flow, even though lung volume is reduced.
2C. NORMAL VALUES
Tables and equations are used to predict the normal values of the measurements to be discussed. The best values have been obtained from nonsmoking, normal subjects. The prediction equations we use in our laboratory are listed in the Appendix. The important prediction variables are the size, sex, and age of the subject. Certain races, African American and Asian, for example, require race-specific values. Size is best estimated with body height. The taller the subject, the larger the lung and its airways, and thus maximal flows are higher. Women have smaller lungs than men of a given height. With aging, lung elasticity is lost, and thus airways are smaller and flows are lower. The inherent variability in normal predictive values must be kept in mind, however (as in the bell-shaped normal distribution curve of statistics). It is almost never known at what point in the normal distribution a given subject starts. For example, lung disease can develop in people with initially above-average lung volumes and flows. Despite a reduction from their initial baseline, they may still have values within the normal range of a population.
PEARL: Body height should not be used to estimate normal values for a subject with kyphoscoliosis. Why? Because the decreased height in such a subject will lead to a gross underestimation of the normal lung volume and flows. Rather, the patient’s arm span should be measured and used instead of height in the reference equations. In a 40-year-old man with kyphoscoliosis, vital capacity is predicted to be 2.78 L if his height of 147 cm is used, but the correct expected value of 5.18 L is predicted if his arm span of 178 cm is used—a 54% difference. The same principle applies to flow predictions.
2D. FORCED EXPIRATORY VITAL CAPACITY
The FVC is the volume expired during the FVC test; in Figure 2-1 the FVC is 4.0 L. Many abnormalities can cause a decrease in the FVC.
PEARL: To our knowledge, only one disorder, acromegaly, causes an abnormal increase in the FVC. The results of other tests of lung function are usually normal in this condition. However, persons with acromegaly are at increased risk for development of obstructive sleep apnea as a result of hypertrophy of the soft tissues of the upper airway.
Figure 2-3 presents a logical approach to considering possible causes of a decrease in FVC:
- The problem may be with the lung itself. There may have been a resectional surgical procedure or areas of collapse. Various other conditions can render the lung less expandable, such as fibrosis, congestive heart failure, and thickened pleura. Obstructive lung diseases may reduce the FVC by limiting deflation of the lung (Fig. 2-3).
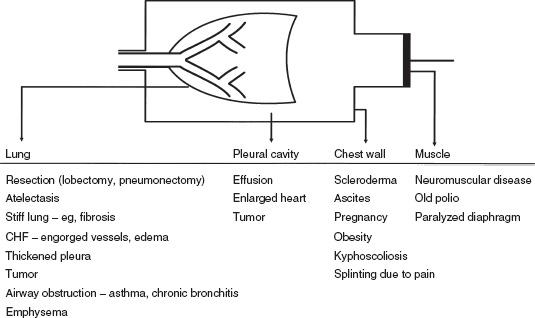
FIG. 2-3. Various conditions that can restrict the forced expiratory vital capacity. CHF, congestive heart failure.
- The problem may be in the pleural cavity, such as an enlarged heart, pleural fluid, or a tumor encroaching on the lung.
- Another possibility is restriction of the chest wall. The lung cannot inflate and deflate normally if the motion of the chest wall (which includes its abdominal components) is restricted.
- Inflation and deflation of the system require normal function of the respiratory muscles, primarily the diaphragm, the intercostal muscles, and the abdominal muscles.
If the four possibilities listed are considered (lung, pleura, chest wall, muscles), the cause(s) of decreased FVC is usually determined. Of course, combinations of conditions occur, such as the enlarged failing heart with engorgement of the pulmonary vessels and pleural effusions. It should be remembered that the FVC is a maximally rapid expiratory vital capacity. The vital capacity may be larger when measured at slow flow rates; this situation is discussed in Chapter 3.
Two terms are frequently used in the interpretation of pulmonary function tests. One is an obstructive defect. This is lung disease that causes a decrease in maximal expiratory flow so that rapid emptying of the lungs is not possible; conditions such as emphysema, chronic bronchitis, and asthma cause this. Frequently, an associated decrease in the FVC occurs. A restrictive defect implies that lung volume, in this case the FVC, is reduced by any of the processes listed in Figure 2-3, except those causing obstruction.
Caution: In a restrictive process, the total lung capacity will be less than normal (see Chapter 3).
Earlier in the chapter, it was noted that most alterations in lung mechanics lead to decreased maximal expiratory flows. Low expiratory flows due to airway obstruction are the hallmark of chronic bronchitis, emphysema, and asthma. The measurements commonly obtained to quantify expiratory obstruction are discussed below.
2E. FORCED EXPIRATORY VOLUME IN 1 SECOND
The FEV1 is the most reproducible, most commonly obtained, and possibly most useful measurement. It is the volume of air exhaled in the first second of the FVC test. The normal value depends on the patient’s size, age, sex, and race, just as does the FVC. Figure 2-4A and B show the FVC and FEV1 from two normal subjects; the larger subject (A) has the higher FVC and FEV1.
When flow rates are slowed by airway obstruction, as in emphysema, the FEV1 is decreased by an amount that reflects the severity of the disease. The FVC also may be reduced, although usually to a lesser degree. Figure 2-4C shows a severe degree of obstruction. The 1-second volume (FEV1) is easily identified directly from the spirogram. A 1-second mark can be added to the FV curve to identify the FEV1, as shown in the figure. The common conditions producing expiratory slowing or obstruction are chronic bronchitis, emphysema, and asthma.
In Figure 2-4D, the FEV1 is reduced because of a restrictive defect, such as pulmonary fibrosis. A logical question is, “How can I tell whether the FEV1 is reduced as a result of airway obstruction or a restrictive process?” This question is considered next.
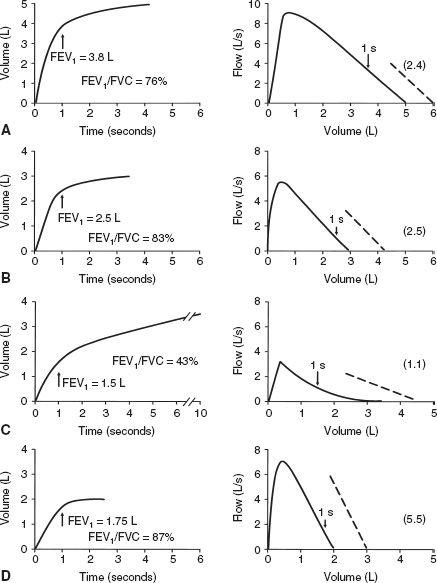
FIG. 2-4. Typical spirograms and flow-volume curves during forced expiration. A and B. Normal subjects of different sizes. C. Patient with severe airway obstruction. D. Values typical of a pulmonary restrictive process. The arrows indicate the forced expiratory volume in 1 second (FEV1). The ratios of FEV1 to forced expiratory vital capacity (FEV1/FVC) and the slopes of the flow-volume curves (dashed lines) are also shown.
2F. FEV1/FVC RATIO
The FEV1/FVC ratio is generally expressed as a percentage. The amount exhaled during the first second is a fairly constant fraction of the FVC, irrespective of lung size. In the normal adult, the ratio ranges from 75 to 85%, but it decreases somewhat with aging. Children have high flows for their size, and thus, their ratios are higher, up to 90%.
The significance of this ratio is twofold. First, it aids in quickly identifying persons with airway obstruction in whom the FVC is reduced. For example, in Figure 2-4C, the FEV1 /FVC is very low at 43%, indicating that the low FVC is due to airway obstruction and not pulmonary restriction. Second, the ratio is valuable for identifying the cause of a low FEV1. In pulmonary restriction (without any associated obstruction), the FEV1 and FVC are decreased proportionally; hence, the ratio is in the normal range, as in the case of fibrosis in Figure 2-4D, in which it is 87%. Indeed, in some cases of pulmonary fibrosis, the ratio may increase even more because of the increased elastic recoil of such a lung.
Thus, in regard to the question of how to determine whether airway obstruction or a restrictive process is causing a reduced FEV1, the answer is to check the FEV1 /FVC ratio. A low FEV1 with a normal ratio usually indicates a restrictive process, whereas a low FEV1 and a decreased ratio signify a predominantly obstructive process.
In severe obstructive lung disease near the end of a forced expiration, the flows maybe very low, barely perceptible. Continuation of the forced expiration can be very tiring and uncomfortable. To avoid patient fatigue, one can substitute the volume expired in 6 seconds, the FEV6, for the FVC in the ratio. Normal values for FEV1 /FEV6 were developed in the third National Health and Nutrition Examination Survey (NHANES III) [1].
PEARL: Look at the FV curve. If significant scooping or concavity can be seen, as in Figure 2-4C, obstruction is usually present (older normal adults usually have some degree of scooping). In addition, look at the slope of the FV curve, the average change in flow divided by the change in volume. In normal subjects, this is roughly 2.5 (2.5 L/s per liter). The normal range is approximately 2.0 to 3.0. In the case of airway obstruction (Fig. 2-4C), the average slope is lower, 1.1. In the patient with fibrosis (Fig. 2-4D), the slope is normal to increased, 5.5. The whole curve needs to be studied.
Caution: Recall that a low FEV1 or FVC and a normal FEV1/FVC ratio usually indicate restriction. However, a subset of patients with a low FEV1 and normal FEV1/FVC ratio also have a normal total lung capacity, which rules out significant restriction. This is termed a nonspecific ventilatory limitation (see pages 37–39, including Fig. 3-8).
2G. OTHER MEASURES OF MAXIMAL EXPIRATORY FLOW
Stay updated, free articles. Join our Telegram channel

Full access? Get Clinical Tree


