Fig. 5.1
Normal and abnormal mesenteric arteries’ waveforms: The normal celiac artery has a low-resistance waveform. A peak systolic velocity of 2.5 m/s or greater is indicative of a significant stenosis. The normal superior mesenteric artery has a high-resistance waveform in the postprandial state and a peak systolic velocity of <2.75 m/s. The inferior mesenteric artery has a waveform similar to the superior mesenteric artery with high resistance. A peak systolic velocity of 2.75 m/s or greater is suggestive of a significant stenosis
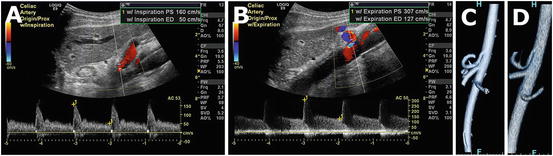
Fig. 5.2
Doppler ultrasound of the celiac artery in inspiration (a) reveals normal peak systolic velocity. During inspiration, the celiac artery moves caudally, and the median arcuate ligament moves anteriorly. With expiration, the opposite occurs, resulting in compression of the artery and elevated velocities (b). Volume rendered computed tomography images in inspiration (c) and expiration (d) are also elucidative.
In published series, the mesenteric arteries have been successfully identified in 85–100 % of patients. There are a few studies reporting duplex evaluation of the IMA but no one with more than 14 % of inappropriate evaluation of the vessel [7–10].
Normal Waveforms
The normal celiac artery and SMA have distinct waveforms reflecting the different end-organ blood supply requirements (Fig. 5.1). The major branches of the celiac artery supply the liver and spleen. These organs are low-resistance arterial beds, resulting in a biphasic celiac artery waveform composed of a peak systolic component and higher end-diastolic flow. The SMA supplies the small bowel and proximal colon. In the fasting state, the Doppler waveform is triphasic, composed of a systolic peak, an early diastolic reversal of flow, and low end-diastolic flow approaching zero. In the postprandial state, due to the normal hyperemic response described in Chap. 2, the end-organ resistance is decreased, and blood flow is increased for adequate food absorption, resulting in changes in the arterial waveform. PSV increases, early diastolic flow reversal disappears, and end-diastolic flow increases. Approximately 45 min after a meal, these changes reach their apex, and the diameter of the SMA also increases by a mean of 112 %. On the other hand, the CA waveform remains similar to the fasting state, basically because of the unchanged demands of the liver and spleen [11]. The Doppler arterial waveform is also affected by food composition, with mixed calorie meals resulting in the most pronounced change [12]. A low-resistance waveform can also be a normal finding if there is a replaced or accessory hepatic artery originating from the SMA. Although IMA examination can be difficult because of small size and posterior location, this vessel can be identified in up to 89 % of patients by skilled sonographers [8]. The IMA supplies the distal colon and upper rectum and therefore has a high-resistance waveform, similar to the triphasic SMA waveform.
Anatomic variations in the origin of the hepatic arteries, which occur in approximately 20 % of the population, can result in changes in the SMA waveform in the fasting state. The most common variation described above is a replaced right hepatic artery originating from the SMA, which occurs in up to 17 % of individuals. In these cases, the typical waveform has a lower-resistance pattern in the SMA, resembling the waveform of a CA. A normal PSV and the finding of a non-turbulent waveform with a clear systolic window favor the diagnosis of an anatomic anomaly as opposed to a stenotic lesion [1].
There is a paucity of data on duplex evaluation of the IMA; consequently its normal and pathological characteristics are not well described. Typically the IMA waveform shows a high-resistance pattern, similar to what is observed for the SMA during fasting state but with a higher resistance index [10]. The IMA is usually not affected by meals unless this vessel provides important compensatory collateral flow to the SMA [5].
Detection of Stenosis
In 1991, Moneta and colleagues reported the first retrospective study evaluating the role of duplex scanning of splanchnic arteries to identify SMA and CA stenosis (Fig. 5.3) in patients undergoing abdominal aortography [13]. In that study, a PSV of >275 cm/s for the SMA and >200 cm/s for the CA accurately detected stenosis >70 %. It also suggested that PSV was a better predictor than EDV and that an aorto-mesenteric ratio had no significant improvement in the ability to diagnose a significant stenosis. A few years later, the same group validated their findings in a prospective study of 100 patients who underwent duplex ultrasound and abdominal aortography, including 13 patients who had investigation for chronic mesenteric ischemia. Duplex ultrasound was able to adequately visualize the SMA in 92 % and the CA in 83 % of cases. Using the previously described PSV criteria, these authors found a sensitivity of 92 %, specificity of 96 %, positive predictive value (PPV) of 80 %, negative predictive value (NPV) of 99 %, and accuracy of 96 % to diagnose 70 % or greater stenosis. For the CA, the same parameters were 87, 80, 63, 94, and 82 %, respectively [14]. At the Mayo Clinic, we use the same criteria for the SMA but have adjusted the celiac artery criteria to 250 cm/s to improve diagnostic accuracy.
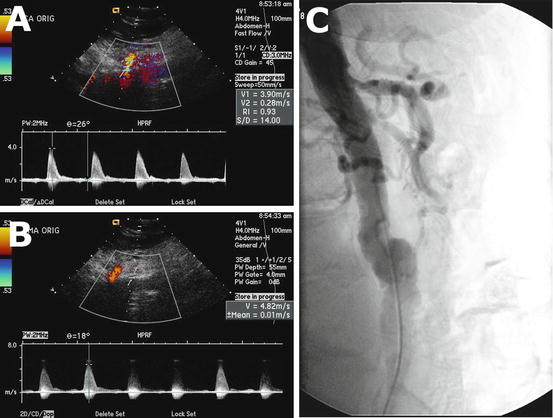
Fig. 5.3
Doppler ultrasound shows elevated peak systolic velocity at the origin of the celiac artery (a) and superior mesenteric artery (b) indicative of a significant stenosis. Angiogram correlation confirms significant stenosis of the celiac and superior mesenteric arteries (c)
Other velocity criterion has been proposed in the literature. In 1991, Bowersox and colleagues reported a retrospective study which identified EDV > 45 cm/s as the most accurate predictor of a >50 % SMA stenosis. [15]. Later, the same group published a prospective study validating these findings. An EDV of >45 cm/s had a sensitivity of 90 %, specificity of 91 %, PPV of 90 %, NPV of 91 %, and accuracy of 91 %. The same parameters for a >50 % stenosis in CA are, respectively, 93, 100, 100, 89, and 95 %.
More recently, AbuRahma and colleagues published results of a retrospective study of 153 patients who underwent angiography to evaluate for chronic mesenteric ischemia. In that study, the best PSV criteria to diagnose >50 and >70 % SMA stenosis were 295 cm/s (accuracy of 88 %) and 400 cm/s (accuracy of 85 %), respectively. The best PSV threshold to identify >50 and >70 % celiac stenosis were 240 cm/s (accuracy of 86 %) and 320 cm/s (accuracy of 85 %), respectively. Differences in velocity criteria in these studies need to be interpreted carefully given distinct methodology, equipment, and patient demographics [16].
Only a few studies have validated the criteria for IMA stenosis. The first one was published by Pellerito and colleagues in 2009, where he proposed the most accurate criteria was a PSV higher than 200 cm/s (specificity of 90 %, specificity of 97 %, PPV of 90 %, and NPV of 97 %) to diagnose >50 % stenosis [9].
AbuRahma and colleagues reported duplex evaluation of 85 patients with suspected chronic mesenteric ischemia. In that report, an IMA PSV of 250 cm/s predicted >50 % stenosis with 95 % of accuracy or 270 cm/s could predict a >70 % stenosis with accuracy of 92 %. In an ROC analysis, none of the criterion proved better than the others to diagnose >50 % stenosis [17]. Others have advocated the use of a test meal in cases where higher velocities are believed to occur for reasons other than stenosis, such as stented vessels. It is expected that, if a stenosis exists, a pressure gradient across the stenosis should develop, and consequent damping of the waveform will be detected. The CA and the IMA must be minimal or not affected by food challenge [5] The data concerning previous studies and the established criteria for SMA, CA, and IMA stenosis are summarized in Tables 5.1, 5.2, and 5.3.
Table 5.1
Most accurate cutoff points to diagnose stenosis of the superior mesenteric artery in different studies
Studies | Design | Stenosis grade | Cutoff (cm/s) | Sb (%) | St (%) | PPV (%) | NPV (%) | Ac (%) |
|---|---|---|---|---|---|---|---|---|
Moneta (1993) [14] | Prospective | ≥70 % | PSV ≥ 275 | 92 | 96 | 80 | 99 | 96 |
Zwolak (1998) [1] | Prospective | ≥50 % | PSV ≥ 300 | 60 | 100 | 100 | 73 | 81 |
AbuRahma (2012) [16] | Retrospective | ≥70 % | PSV ≥ 400 | 72 | 93 | 84 | 85 | 85 |
PSV ≥ 410 | 68 | 95 | 88 | 84 | 85 | |||
EDV ≥ 70 | 65 | 95 | 89 | 82 | 84 | |||
≥50 % | PSV ≥ 295 | 87 | 89 | 91 | 84 | 88 | ||
EDV ≥ 45 | 79 | 79 | 84 | 72 | 79 |
Table 5.2
Most accurate cutoff points to diagnose stenosis of the celiac artery in different studies
Studies | Design | Stenosis grade | Cutoff (cm/s) | Sb (%) | St (%) | PPV (%) | NPV (%) | Ac (%) |
|---|---|---|---|---|---|---|---|---|
Moneta (1993) [14] | Prospective | ≥70 % | PSV ≥ 200 | 87 | 80 | 63 | 94 | 82 |
Zwolak (1998) [1] | Prospective | ≥50 % | PSV ≥ 200 | 93 | 94 | 96 | 88 | 93 |
EDV ≥ 55 | 93 | 100 | 100 | 89 | 95 | |||
AbuRahma (2012) [16] | Retrospective | ≥70 % | PSV ≥ 320 | 80 | 89 | 84 | 86 | 85 |
EDV ≥ 100 | 58 | 91 | 83 | 74 | 77 | |||
EDV ≥ 110 | 56 | 92 | 85 | 74 | 77 | |||
EDV ≥ 120 | 53 | 95 | 89 | 73 | 77 | |||
≥50 % | PSV ≥ 240 | 87 | 83 | 93 | 72 | 86 | ||
EDV ≥ 40 | 84
Stay updated, free articles. Join our Telegram channel
Full access? Get Clinical Tree
 Get Clinical Tree app for offline access

|