CHAPTER 3 Doppler – velocities and pressures
3.1 SPECIAL USES OF DOPPLER
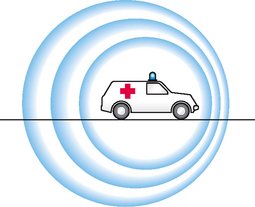
The Doppler effect (Fig. 3.1), described by the Austrian physicist and mathematician Christian Johann Doppler in 1842, is a change in the frequency of sound, light or other waves caused by the motion of the source or the observer. An example is the change in the sound of an ambulance siren as it approaches (higher pitch) and then passes (lower pitch) an observer. The change is due to compression and rarefaction of sound waves. There is a direct relationship between the relative velocity of the sound source and the observer and the change in pitch.
Measuring blood velocity and pressure gradients
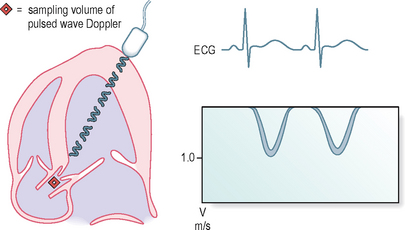
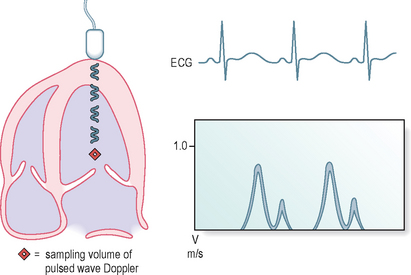
The Doppler effect can be used to examine the direction and velocity of blood flow in blood vessels and within the heart. Ultrasound waves of a known frequency (usually around 2 MHz) are transmitted from the transducer and are reflected by moving blood back towards the transducer, which also acts as an ultrasound receiver. If the blood is moving towards the transducer, the frequency of the ultrasound signal increases and vice versa. This can be used by computer analysis to derive haemodynamic information such as the nature and severity of valvular abnormalities (e.g. valvular stenosis) since it is possible to relate velocity to pressure difference (also referred to as pressure gradient) by a simple equation (below). Doppler can also detect the presence of valvular regurgitation and give an indication of its severity. This information can complement the anatomical information provided by M-mode and 2-D echo techniques. The Doppler-measured flow patterns and velocities across the heart valves can be displayed graphically against time on the screen of the echo machine or printed on paper. By convention, velocities towards the transducer are displayed above the line and those away from it below the line. The normal flow patterns for the aortic and mitral valves are shown below (Figs 3.2 and 3.3).
This is a graph of velocity against time, but it also gives a densitometric dimension, since the density of any spot is related to the strength of the reflected signal, which relates to the number of reflecting red blood cells moving at that velocity. In normal situations where blood flow is laminar (smooth), most of the blood cells travel at more-or-less the same velocity, accelerating and decelerating together (Fig. 3.4). The Doppler pattern then has an outline form with very few cells travelling at other velocities at a given time. When there is turbulence of flow, e.g. due to a narrowed valve, there is a wide distribution of blood cell velocities, and the Doppler signal is ‘filled in’.
The peak Doppler velocities in normal adults and children are (in m/s):
| Valve | Peak | Range |
|---|---|---|
| Aortic valve/aorta | 1.3 | (0.9–1.7) |
| Left ventricle | 0.9 | (0.7–1.1) |
| Mitral valve | 0.9 | (0.6–1.3) |
| Tricuspid valve | 0.5 | (0.3–0.7) |
| Pulmonary valve/artery | 0.75 | (0.5–1.0) |
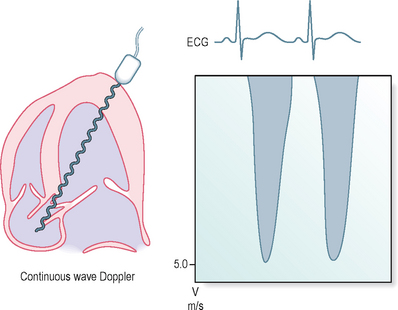
The normal stroke volume in a resting adult is approximately 70 mL. This volume of blood passes across the AV with each ventricular systole, at a blood velocity of approximately 1 m/s. If the AV is stenosed, with a smaller valve orifice cross-sectional area, then for the same volume of blood to be ejected, the blood must accelerate, and this increase in velocity can be measured using Doppler with the ultrasound transducer at the cardiac apex and transmitting sound waves continuously (Fig. 3.5). Since the blood is moving away from the echo transducer, the Doppler velocity signal is below the baseline. In this case, the peak blood velocity across the AV is 5 m/s.
Stay updated, free articles. Join our Telegram channel

Full access? Get Clinical Tree


