Doppler Physics
Echo can be used to examine not just the heart’s anatomical structure but also the flow of blood through the heart. This in turn provides valuable information about valvular function, intracardiac shunts and so forth. The study of the heart’s fluid dynamics is made possible by the Doppler principle, discussed in this chapter. As well as allowing the assessment of blood flow, the Doppler principle has also, more recently, been applied to the study of myocardial function (tissue Doppler imaging).
DOPPLER PRINCIPLES
The Doppler effect describes how an observer perceives a change in the wavelength or frequency of a sound (or light) wave if the source is moving relative to them. A classic example is that of a moving ambulance sounding its siren – as the ambulance approaches an observer, its siren sounds higher pitched than when it is moving away. Figure 4.1 shows how sound waves from a source, moving towards observer A, shorten in wavelength (and therefore increase in frequency) in the direction of movement. Observer A would therefore hear a higher pitch, and observer B a lower pitch, than if the source was stationary.
The same phenomenon occurs with ultrasound waves when they are reflected from moving red blood cells. The frequency of the returning ultrasound is increased if the red blood cells are moving towards the ultrasound transducer, or decreased if they are moving away. This change in frequency between the transmitted and returning ultrasound signal is the Doppler shift, from which the velocity (V) of the red blood cells can be calculated:
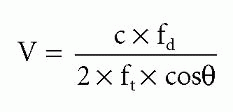
where c is the speed of sound in blood, fd is the Doppler shift in frequency between transmitted and returning signals, ft is the frequency of the transmitted signal, and θ is the angle between the ultrasound beam and the direction of blood flow.
It follows from this equation that a large angle between the direction of blood flow and the ultrasound beam will lead to an underestimation of flow velocity, and this is particularly marked for angles >20°. For this reason, when undertaking echo Doppler studies it is important to align the ultrasound beam with the direction of blood flow as closely as possible.
SPECTRAL DOPPLER
When the ultrasound beam returns to the transducer, the difference in frequency between the transmitted and returning beams is compared to calculate the Doppler shift. This is a complex process as the returning signal contains a spectrum of
frequencies, and a mathematical technique called a fast Fourier transform is used to undertake the necessary spectral analysis.
frequencies, and a mathematical technique called a fast Fourier transform is used to undertake the necessary spectral analysis.
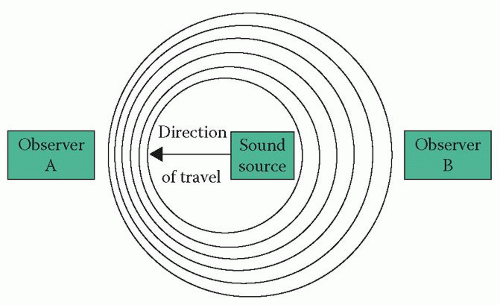 Figure 4.1 The Doppler effect |
A spectral Doppler display can then be produced (Fig. 4.2). These displays conventionally plot frequency shifts (shown as velocities) on the vertical axis against time on the horizontal axis. A zero line is shown, and flow towards the transducer is plotted above the line (and flow away from the transducer, as in Fig. 4.2, is plotted below the line). For each time point the grey pixels show the blood flow velocity detected, and the density of the signal (i.e. the shade of grey plotted at each point in the spectrum) represents the amplitude of the signal at that particular velocity (i.e. the proportion of red blood cells moving at that particular velocity). The overall brightness of the greyscale display can also be adjusted by the sonographer, using the Doppler gain setting. Such spectral displays form the basis of continuous wave (CW) and pulsed-wave (PW) Doppler techniques (see below).
Transmit power, which controls the amount of ultrasound energy delivered to the patient.
Gain, which amplifies the received signal to increase the brightness of the displayed spectral trace. High gain settings amplify weaker signals that might otherwise not be visible, but increase noise.
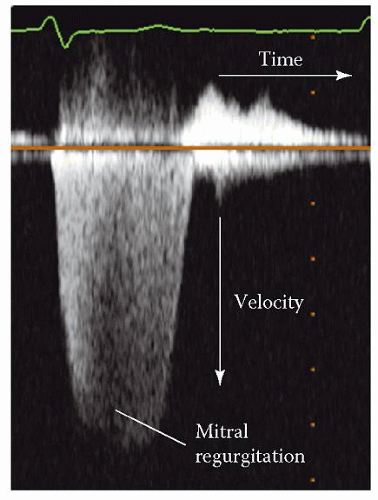 Figure 4.2 Spectral Doppler display (showing mitral regurgitation) |
Baseline shift, which shifts the ‘zero point’ of the display up or down.
Velocity range, which alters the vertical velocity scale to a higher or lower range.
The frequency range seen with Doppler shift (-10 to +10 kHz) falls within the audible range of the human ear, so it is possible to listen to blood flow via the loudspeaker on the echo machine, adjusting the volume as appropriate, and to use the audible ‘quality’ of the sound to guide fine adjustments in the alignment of the ultrasound beam with the blood flow, in order to obtain the best possible signal.
Continuous wave Doppler
CW Doppler uses continuous transmission and receiving of ultrasound (unlike the intermittent pulses used in 2D imaging). Two crystals in the transducer are used, one to transmit an ultrasound signal and the other to receive the returning signal. A dedicated CW Doppler probe (‘pencil probe’) can also be used; this contains two crystals specifically for performing CW Doppler.
A typical CW Doppler display, obtained by interrogating flow across the mitral valve in the apical 4-chamber view, is shown in Figure 4.3. This shows a positive spectral trace above the zero line which corresponds to forward flow across the valve during diastole, and a negative trace below the line corresponding to regurgitant flow during systole. The 2D image/colour Doppler image in the upper part of the figure shows the positioning of the cursor to align the ultrasound beam with the mitral valve flow.
It is important to appreciate that, in CW Doppler, the echo machine obtains signals along the entire length of the ultrasound beam (or cursor line) – the resulting spectral trace therefore reflects the direction and velocity of movement of red blood cells at every point along the beam, and so CW Doppler is unable to assess flow at any one specific point in the heart. The spectral display reflects the full range of red blood cell velocities detected along the beam at any particular time point, usually ranging from zero up to the peak velocity demarcated by the edge of the spectral trace.
Although the inability to discriminate flow velocity at any specific point puts CW Doppler at a disadvantage in comparison to the specific sampling ability of PW Doppler, CW Doppler has the advantage of being able to measure higher velocities without aliasing (see below).
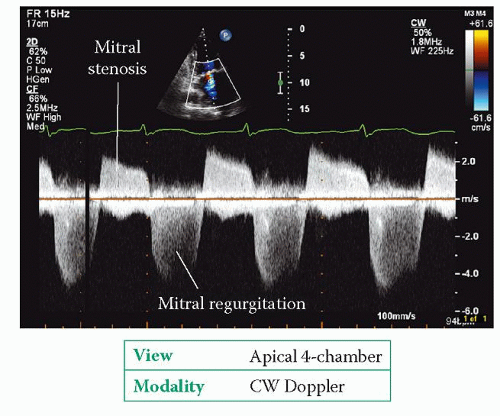 Figure 4.3 Continuous wave Doppler imaging, showing mitral stenosis and regurgitation |
Pulsed-wave Doppler
PW Doppler measures blood flow velocity at a specific location, which the sonographer chooses by placing a sample volume (indicated by two parallel lines perpendicular to the main cursor line) at the point of interest (Fig. 4.4). The length of the sample volume can be adjusted by the sonographer – typically a length of 3 mm is used.
In order to measure Doppler shift (and hence flow velocity) within the boundaries of the sample volume, the transducer cannot use continuous transmission/reception of ultrasound. Instead, the transducer transmits an ultrasound pulse and then only samples the reflected signal as it returns from the point of interest – the machine can calculate how long the signal will take to make the return journey between the transducer and the sample volume, and ‘listens out’ for the returning signal at that time point. In doing so, the machine ‘ignores’ the returning ultrasound from all other points along the beam.
The fact that the echo machine has to transmit a pulse and then wait for it to return places a limit on how rapidly it can send out consecutive pulses – the pulse repetition frequency (PRF


Stay updated, free articles. Join our Telegram channel
Full access? Get Clinical Tree
