Fig. 30.1
(a, b) Standard 12-lead ECG at rest. See the chapter for the description
Regular RR interval with a heart rate of 75 bpm.
P wave is apparently increased in amplitude and duration; however, watching carefully, we can notice that the amplitude of the P wave doesn’t reach a pathologic value. In fact the maximum amplitude is 0.20 mV in II lead. Also the duration is mildly prolonged, with the maximum P wave duration of 120 milliseconds (ms) reached in II lead. P wave morphology can be considered pathological: if we pay attention on the P wave in II, III, and aVF leads, we can notice that the first part is high and narrow and it’s followed by a second part that is smaller and larger than the first one. This is a likely sign of biatrial enlargement. P wave axis is 90°, being negative in aVR and aVL leads, biphasic in I lead, and positive in II, II, and aVF leads. A negative P wave in aVL is something to think about.
PQ interval is normal (160 ms).
QRS complex is clearly enlarged (160 ms) with a normal amplitude. However, it decreases progressively from V1 to V6. Looking at precordial leads, the morphology is typical for right bundle branch block. In the limb leads, the QRS complex has a strange morphology. A deep S wave, typical for RBBB, in I and aVL leads is missing, and the intraventricular and interventricular conduction disturbance seems to be more complex than in a simple RBBB. Also the “rS” morphology in aVR lead and the “rSR’” in aVL leads are not typical for RBBB. Axis is indeterminable.
Repolarization is not abnormal because this is secondary to the conduction disturbance. The QT interval measures 400 ms and the QTc 447 ms.
Conclusions
ECG shows sinus rhythm, normal heart rate, right and left atrial enlargement, normal atrioventricular conduction, right bundle branch block, and secondary repolarization’s abnormalities.
Looking at a previous chest X-ray, something unexpected was found (Fig. 30.2).
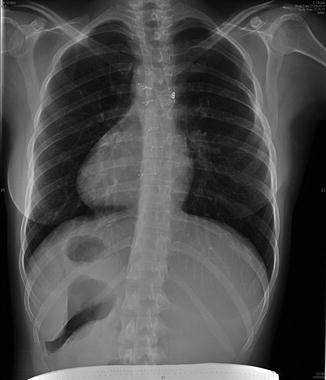
Fig. 30.2
Chest X-ray. Please notice the cardiac apex and the gastric bubble placed to the right side
The patient had a situs viscerum inversus with dextrocardia (please note the cardiac apex and the gastric bubble placed on the right side). Moreover, the patient had tetralogy of Fallot and underwent a surgical correction when she was a child.
Taking a new look to the previous ECG, we can now relate some findings with the anatomic abnormalities.
First of all, the axis of the P wave is not normal. The notch on the apex of the P wave is not a sign of an atrial enlargement. In fact in young people, the P wave duration can be normal up to 130 ms. The notch is a sign of interatrial conduction disturbance compatible also with the previous surgical intervention.
The previously diagnosed RBBB is a left bundle branch block. In dextrocardia, the morphological left bundle branch is placed on the right, and its conduction disturbance could be due to the interventricular septal defect that is always present in tetralogy of Fallot. The other intraventricular and interventricular conduction disturbances could be linked to the previous surgical intervention.
The atypical morphology of QRS complex in aVR and aVL leads can be related to dextrocardia too. In fact, in RBBB, “rSR’” and “qR” morphologies in aVR lead and a deep or large S wave in aVL lead are common findings, and in this case, the morphologies are inverted between the two leads.
By comparing the previous ECG with the following, it is visible that in the typical RBBB (ECG from another patient below), the QRS morphologies in aVR and aVL are switched (Fig. 30.3a,b).
Fig. 30.3
(a, b) Standard 12-lead ECG at rest from another patient having a situs solitus and an RBBB. Please compare with the ECG in Fig. 30.1
A sign that could suggest the presence of dextrocardia is the decreasing amplitude of the QRS complex from V1 to V6 together with the negative P wave in aVL. This happens because the electrodes are placed on the left part on the chest and the electric signal from the heart is progressively going farther from the precordial leads, in particular from the left ones.
30.2 The Normal P Wave
P wave comes from the electrocardiogram sign of atrial depolarization. The impulse starts from the sinoatrial (SA) node and spreads to the right atrium first and then through the interatrial septum to the left atrium.
Its normal duration varies from 70 to 140 ms even in normal subjects [1]. A P wave lasting more than 110 ms can be considered abnormal.
The P wave axis is the result of the electrical activation of the right atrium (directed anteriorly first and then posteriorly when involving the inferior wall) and of the left atrium (directed posteriorly). Therefore, on the limb leads, the normal P wave range is 0° to +75°. That’s why the normal P wave is positive in I and II leads and always negative in aVR lead. Moreover, also in the precordial leads from V3 to V6, the P wave is generally positive. Conversely in V1 and V2, normal P wave is often diphasic and sometimes even negative.
Talking about the normal amplitude of the P wave, we have to say that it’s affected by many factors such as the distance of electrodes from the heart and the level of atrial fibrosis. In the limb leads, a P wave inferior or equal to 0.25 mV or 25 % of the following R wave is considered as normal amplitude. In the precordial leads, the normal amplitude is a bit lower and doesn’t exceed 0.15 mV [1].
30.3 Interatrial Conduction Delay
Atrial depolarization begins in the sinus node; from here, the electrical impulse goes through the internodal fascicles (fibers that connect sinus with the AV node). There are three bundles: the Bachman fascicle (anterior), the Thorel fascicle (in an intermediate position), and the Wenckebach fascicle (posterior). The last one conducts the impulse from the right to the left atrium, too. So, the atria activation begins from the right atrium and then reaches the left one. The normal duration of P wave is from 50 to 80 ms. A P wave duration superior to 110 ms is pathological and related to interatrial conduction delay. This condition is caused by a complete or partial interruption of the Bachman fascicle or other connecting atria fibers. Usually the interatrial conduction delay is associated with a modification of the axis of the terminal part of P wave. It is more negative (from −30° to −60°) with a caudal-cranial activation of the left atrium. This pattern of activation is visible as a biphasic P wave (positive-negative, with terminal negative component evident in inferior leads) lasting more than or equal to 100 ms. The interatrial conduction delay is highly specific of left atrium enlargement [1, 2].
30.4 P Wave Other Than That from the Sinus Node
The P wave is defined not to be sinusal when it originates from an ectopic focus that can be located in variable parts of the atria. A non-sinus P wave can be present as a premature atrial impulse (isolated or in pairs), as an ectopic atrial tachycardia (heart rate ≥ 100 bpm), or as an ectopic atrial rhythm (heart rate < 100 bpm).
< div class='tao-gold-member'>
Only gold members can continue reading. Log In or Register to continue
Stay updated, free articles. Join our Telegram channel

Full access? Get Clinical Tree


