Tissue Doppler imaging measurements could be used to quantitate ventricular function in patients with systemic single ventricles. The objective of the present study was to measure the tissue doppler imaging-derived indexes of function and dyssynchrony in patients with single ventricular physiology and compare these values with those from control patients. Echocardiograms were performed in patients with single left or right ventricular physiology and control patients. Measurements were made of the free walls at the level of the atrioventricular annulus. Differences were assessed with one-way analysis of variance. Post hoc comparisons were performed with a Tukey adjustment. No significant difference was present in age among the control (5.75 ± 1.73 years, n = 16), single left ventricle (7.07 ± 2.81 years, n = 12), or single right ventricle (6.25 ± 2.2 years, n = 14) groups. The single right ventricular free wall peak systolic annular, peak early diastolic annular, and peak late diastolic annular velocities were significantly lower and the myocardial performance index and interval to mechanical activation greater compared to the controls. The single left ventricular free wall peak systolic annular, peak early diastolic annular, and peak late diastolic annular velocities were also significantly lower and the myocardial performance index and interval to mechanical activation greater compared to controls. In conclusion, significant decreases in systolic and diastolic function, as well as differences in dyssynchrony, using tissue doppler imaging exist in patients with single ventricular physiology compared to control patients.
The objective of the present study was to use tissue Doppler imaging (TDI) as a diagnostic tool to quantify systolic and diastolic function and mechanical dyssynchrony in pediatric patients with a systemic single ventricle, either right or left, after Fontan palliation and to compare those values with age-matched control patients. Our hypothesis was that significant differences would be present in the systolic and diastolic parameters and mechanical dyssynchrony in the patients with single ventricular physiology compared to the control patients.
Methods
Patients with either single right ventricular or single left ventricular physiology after Fontan or Kawashima palliation were identified and recruited. Patients who had had a cardiac hospitalization or had undergone cardiac surgery or a cardiac catheterization procedure within the past 3 months were excluded. Patients who were chronically paced were also excluded. Age-matched control subjects with normal cardiac anatomy and ventricular function without any systemic disorder that would affect the loading conditions were recruited and prospectively identified by echocardiography. Any control subjects with abnormal findings on the surface echocardiograms were excluded. The demographic variables were documented. The institutional review board approved this prospective cross-sectional study.
Echocardiograms were performed by a single echocardiographer (CC) on a Vivid 7 or Vivid I echocardiographic platform (General Electric, Wauwatosa, Wisconsin). All measurements were made in triplicate by a single observer (JH). In the patients with a single ventricle, views equivalent to a standard apical 4 chamber were obtained ( Figures 1 and 2 ). Systemic atrioventricular valve inflow velocities (E and A) were recorded from the apical 4 chamber at the tips of the valve leaflets. Corresponding inflow Doppler measurements from both atrioventricular valves were also obtained in the control patients. The E/A ratios for the respective ventricles were calculated. The control patients underwent M-mode measurements of the left ventricle (LV) to calculate the shortening fraction. The control patients and patients with a single LV also had the ejection fraction measured using the modified Simpson method.

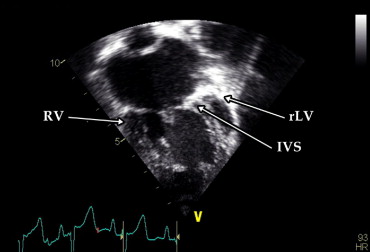
The TDI velocities of the right free wall, interventricular septum (IVS), and left free wall at the level of the respective atrioventricular valve annulus were obtained for the control patients. The TDI velocities were obtained for both the right and left ventricular free walls at the level of the atrioventricular valve annulus in all patients with a single ventricle. Patients with a definable rudimentary ventricular chamber had measurements taken of the IVS. The images were transferred and analyzed off-line on an EchoPac 7 workstation (General Electric). The TDI measurements included the peak systolic annular velocity (s), peak early diastolic annular velocity (e), and peak late diastolic annular velocity (a). The free wall e wave was used to compute the E/e and e/a ratios for the respective ventricles. The myocardial performance index (MPI) was calculated for each ventricle using the corresponding TDI values of the free wall with the equation: MPI = (isovolumetric contraction time + isovolumetric relaxation time)/ejection time ( Figure 3 ).
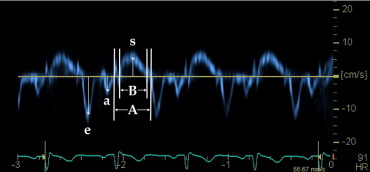
Dyssynchrony measurements from the free wall TDI images were taken from the onset of the QRS wave on a simultaneous electrocardiogram to the onset of the s wave. The absolute difference between the right and left ventricular free wall dyssynchrony intervals was determined. A simplified Yu index was also calculated by obtaining the standard deviation of the mechanical dyssynchrony values of the right and left ventricular free walls.
Data were collected and compared for all single ventricle and control patients. Differences between groups were assessed by one-way analysis of variance. Post hoc comparisons were performed with a Tukey adjustment for the 3 groups. No adjustments of the outcome measurements were made. The α value was set at 0.05. Pearson’s correlation was performed to test for associations between the ejection fraction and left ventrcilar and IVS variables. Statistical analysis was performed using the Statistical Package for Social Sciences, version 17.0 (SPSS, Chicago, Illinois).
Results
A total of 16 control patients and 14 and 12 patients with a single right ventricle (RV) and single LV, respectively, were studied. One patient with a single RV had mild tricuspid valve (TV) stenosis with a history of TV repair; therefore, the TV E, A, and E/A values for this patient were not included in the data analysis. Another patient with a single RV had fusion of the TDI e and a wave of the right ventricular free wall; thus, the MPI of that wall could not be calculated.
The demographic information revealed no differences amonng the 3 groups except for significantly lower oxygen saturations in the patients with a single ventricle compared to the control group. No difference was found in the oxygen saturation between the patients with a single left and single RV ( Table 1 ). Surgical palliation included a Kawashima procedure, fenestrated Fontan procedures, and nonfenestrated Fontan procedures ( Table 2 ). Most patients with a single RV had an underlying diagnosis of hypoplastic left heart syndrome ( Table 2 ). The most common diagnosis for patients with a single LV was a double inlet LV ( Table 2 ).
| Variable | Control (n = 16) | Single LV (n = 12) | Single RV (n = 14) | p Value |
|---|---|---|---|---|
| Age (years) | 5.8 ± 1.7 | 7.1 ± 2.8 | 6.3 ± 2.2 | NS |
| Weight (kg) | 21.2 ± 4.9 | 24.3 ± 10.5 | 20.2 ± 4.0 | NS |
| Oxygen saturation (%) | 98.5 ± 1.2% | 92.1 ± 5.7% | 94.3 ± 4.9% | 0.001 ⁎ |
⁎ Significant difference between control group compared to both single RV and single LV groups; no difference found between single RV and LV groups.
| Group | Patients (n) |
|---|---|
| Single right ventricle | |
| Hypoplastic left heart syndrome | 11 (79%) |
| Nonfenestrated | 9 (64%) |
| Fenestrated | 2 (14%) |
| Double outlet right ventricle | 2 (14%) |
| Nonfenestrated | 1 (7%) |
| Kawashima | 1 (7%) |
| Atrioventricular septal defect (right dominant; fenestrated) | 1 (7%) |
| Single left ventricle | |
| Double inlet left ventricle | 5 (42%) |
| Nonfenestrated | 2 (17%) |
| Fenestrated | 3 (25%) |
| Tricuspid atresia | 4 (34%) |
| Nonfenestrated | 2 (17%) |
| Fenestrated | 2 (17%) |
| Severe tricuspid stenosis (nonfenestrated) | 1 (8%) |
| Atrioventricular septal defect (left dominant; nonfenestrated) | 1 (8%) |
| Pulmonary atresia with intact ventricular septum (nonfenestrated) | 1 (8%) |
All echocardiograms were read by a staff echocardiologist as showing qualitatively normal systolic function, except for 1 patient with a single RV, who had qualitatively mildly depressed systolic function. The control patients had a normal left ventricular shortening fraction (38.0 ± 2.7%). The ejection fraction of the control patients was 62.9 ± 3.7%. For the patients with a single LV, it was 56.3 ± 4.9% (p <0.05). The ejection fraction correlated significantly with the mitral valve E (r = 0.7), mitral valve E/A (r = 0.5), LV e (r = 0.6), LV a (r = 0.5), LV s (r = 0.5), LV MPI (r = −0.5), IVS e (r = 0.5), IVS s (r = 0.5), and IVS dyssynchrony (r = −0.6).
The TV A wave and E/e ratio were significantly greater and the E/A ratio signficantly lower in the patients with a single RV compared to those in the controls. The single right ventricular free wall e, a, and s wave velocities were also markedly lower and the MPI significantly greater compared to the values from the right ventricular free wall of the control patients. No significant difference was found in the single right ventricular free wall e, a, and s wave velocities and MPI compared to the rudimentary right ventricular free wall in the patients with a single LV ( Table 3 ).
| Variable | Control (n = 16) | Single LV (n = 12) | Single RV (n = 14) |
|---|---|---|---|
| Mitral valve E (cm/s) | 101.1 ± 17.4 | 68.9 ± 9.4 ⁎ | — |
| Mitral valve A (cm/s) | 52.7 ± 13.3 | 49.8 ± 20.0 | — |
| Mitral valve E/A ratio | 2.0 ± 0.4 | 1.6 ± 0.5 ⁎ | — |
| Tricuspid valve E † | 66.6 ± 11.0 | — | 72.3 ± 14.6 |
| Tricuspid valve A † | 37.1 ± 11.2 | — | 55.2 ± 18.0 ‡ |
| Tricuspid valve E/A ratio † | 1.9 ± 0.5 | — | 1.37 ± 0.3 ‡ |
| Left ventricular e (cm/s) | 15.8 ± 3.2 | 9.9 ± 3.2 § | 7.1 ± 1.9 § |
| Left ventricular a (cm/s) | 5.9 ± 1.1 | 4.4 ± 0.9 ¶ | 4.6 ± 1.6 ¶ |
| Left ventricular s (cm/s) | 8.9 ± 1.9 | 5.9 ± 1.6 § | 4.3 ± 0.9 § |
| Left ventricular E/e ratio | 6.7 ± 1.9 | 8.1 ± 4.7 | — |
| Left ventricular e/a ratio | 2.8 ± 0.9 | 2.3 ± 0.6 | 1.6 ± 0.5 ∥ |
| Left ventricular myocardial performance index | 0.4 ± 0.0 | 0.5 ± 0.1 § | 0.6 ± 0.1 § |
| Right ventricular e (cm/s) | 15.4 ± 2.8 | 6.4 ± 2.2 ¶ | 7.6 ± 1.9 ¶ |
| Right ventricular a (cm/s) | 8.2 ± 1.0 | 3.9 ± 1.4 ¶ | 4.7 ± 1.7 ¶ |
| Right ventricular s (cm/s) | 13.2 ± 0.9 | 4.3 ± 1.0 ¶ | 5.0 ± 0.9 ¶ |
| Right ventricular E/e ratio † | 4.5 ± 1.2 | — | 9.8 ± 3.2 ‡ |
| Right ventricular e/a ratio † | 1.9 ± 0.4 | 1.9 ± 0.9 | 1.8 ± 0.7 |
| Right ventricular myocardial performance index † | 0.3 ± 0.1 | 0.6 ± 0.1 ¶ | 0.5 ± 0.1 ¶ |
⁎ p <0.05 for controls versus single LV group only;
‡ p <0.05 for controls versus single RV group only;
§ p <0.05 for comparison among all 3 groups;
¶ p <0.05 for controls versus single RV and single LV groups;
∥ p <0.05 for single RV group versus control and single LV groups.
Stay updated, free articles. Join our Telegram channel

Full access? Get Clinical Tree


