Takotsubo cardiomyopathy (TC) is characterized by an acute transient left ventricular systolic dysfunction mimicking acute coronary syndrome (ACS) without significant coronary stenosis. The aim of this study was to examine the electrocardiographic repolarization patterns of TC and ACS and to compare them from hospital admission to hospital discharge. Forty-five patients with TC were matched with 45 patients with ACS according to age, gender, and presence or absence of ST elevation at hospital admission. A complete 12-lead electrocardiography was performed within 12 hours after symptoms onset and then repeated after 3, 5, and 7 days. All patients underwent coronary angiography, and patients with ACS also underwent percutaneous revascularization. Within 12 hours from the symptoms’ onset, patients with TC had a significantly fewer number of leads with ST elevation and a significantly more number of leads with T-wave inversion. These differences, however, were not present after 72 hours and a similar trend was seen over time during the 7-day follow-up. Patients with TC had a significant longer corrected QT interval at admission and during the whole follow-up. In conclusion, in the electrocardiograms collected 12 hours within symptoms onset, patients with TC and those with ACS showed significant differences in cardiac repolarization. However, the number of leads with either ST-segment deviation or T-wave alterations in patients with TC soon matched the ACS group undergoing percutaneous revascularization. In contrast, corrected QT interval was persistently longer in patients with TC and, despite a similar reduction in length over time in both groups, it was still significantly longer after 7 days.
Takotsubo cardiomyopathy (TC), also known as stress cardiomyopathy or apical ballooning syndrome, is characterized by an acute, reversible, and transient left ventricular systolic dysfunction mimicking acute coronary syndrome (ACS) without significant stenosis on coronary angiography. It was first described in Japan in 1990 by Dote et al who named this condition as “takotsubo”, observing that the particular shape of the end-systolic left ventricle during ventriculography was similar to the typical round-bottom and narrow-neck pot used by Japanese fishermen for trapping octopuses. Most patients with TC are postmenopausal women presenting with chest discomfort, elevated myocardial markers, and ischemic electrocardiographic (ECG) changes, frequently precipitated by acute emotional or physical distress. Although many studies had tried to define ECG differences and similarities between TC and ACS at the time of presentation, the proposed ECG markers have not been validated by subsequent reports and are still not widely accepted. Moreover, time-related changes in ECG repolarization between TC and ACS have never been compared. The aim of this prospective observational study was to examine the ECG features of TC and ACS and to compare them from hospital admission to hospital discharge to define differences and similarities in the repolarization patterns over time.
Methods
From August 2010 to October 2012, we prospectively studied 45 consecutive patients admitted to “Ospedali Riuniti” Hospital in Ancona, Italy or “Guglielmo da Saliceto” Hospital in Piacenza, Italy with a diagnosis of TC. TC diagnosis was performed according to the Mayo Clinic criteria. TC cases were matched with 45 patients admitted to the aforementioned hospitals with a diagnosis of ACS. ACS was defined according to the European Society of Cardiology guidelines on myocardial infarction. Case-control matching was performed in the following way: for each patient with TC enrolled, all subsequent patients with ACS were screened until a patient of the same gender, in the same decade of age, and with a concordant ST-segment pattern at presentation (ST elevation in the anterior, lateral, or inferior leads or no ST elevation) was found. Patients who were admitted >12 hours after the symptoms’ onset were excluded, as were those who refused to give written informed consent for participating in this study.
A complete 12-lead electrocardiography was performed at admission (day 1) and was then repeated after 3, 5, and 7 days after admission. This schedule was set by consensus to match the different clinical practices between all the wards involved in the study. The electrocardiogram was recorded at a paper speed of 25 mm/s with a 10 mm/mV amplification scale. The first electrocardiography was performed before coronary angiography in all patients.
Four different physicians independently analyzed all the tracings using a ruler with the help of a magnification glass. ST-segment elevation and depression were assessed at the J point in each lead, quantified, and rounded to the nearest millimeter. When ST elevation was present, reciprocal ST depression was not quantified but only presence or absence of reciprocal changes was recorded as a dichotomous variable. T-wave inversion was assessed in each lead, quantified, and rounded to the nearest millimeter. A biphasic T wave was considered as inverted if the negative amplitude exceeded the positive amplitude. Corrected QT interval (QTc) was calculated according to the Bazzett’s formula. Long QTc was defined as ≥450 ms in men and ≥460 ms in women. Each physician was blinded to the diagnosis and was unaware of the patient’s characteristics. Differences between physicians’ measurements were resolved by consensus. No patient reported significant alterations in previous electrocardiograms, although physicians were able to confirm this data only for 75 patients, as 15 patients (13 with TC and 2 with ACS) had no previous electrocardiograms available for comparison.
All patients underwent coronary angiography and ventriculography. In patients with ACS, balloon angioplasty and coronary stenting were performed immediately after diagnostic catheterization. Thrombolysis In Myocardial Infarction flow 3 was obtained in all patients with ACS.
SPSS 15.0 for Windows (SPSS Inc., Chicago, Illinois) was used for the statistical analyses. A value of p <0.05 (2 tailed) was considered as statistically significant. Categorical variables were described as absolute and relative prevalence and were assessed using chi-square analysis. Quantitative variables were checked for normality by the Kolmogorov-Smirnov test. Normally distributed quantitative variables were described as mean ± SD, whereas non–normally distributed quantitative variables were described as median and interquartile range. Analysis of variance was used to compare normally distributed quantitative variables. Kruskal-Wallis analysis of variance was used to compare non–normally distributed quantitative variables. General linear model for repeated measurements was used to assess time-dependent and group-dependent changes in ECG measurements between days 1, 3, 5, and 7. Because there were multiple comparisons, differences between TC and ACS for each single time point were assessed with independent sample t test and p values corrected according to Bonferroni.
Results
General characteristics of the population are listed in Table 1 . All patients with ACS underwent percutaneous revascularization within 36 hours from the symptoms’ onset (median time 14 hours, interquartile range 4 to 27 hours). Percutaneous coronary intervention and stenting were performed in 27 patients with ACS on the anterior descending artery, 16 patients with ACS on the circumflex artery, and 8 patients with ACS on the right coronary artery (note that the total sum is >100% because 5 patients had >1 vessel treated).
| Variable | Total Population, n = 90 (%) | Takotsubo, n = 45 (%) | ACS, n = 45 (%) | p |
|---|---|---|---|---|
| Age (yrs) | 66.6 ± 11.7 | 68.6 ± 11.5 | 64.5 ± 11.8 | 0.482 |
| Women | 74 (82) | 37 (82) | 37 (82) | 1 |
| Systolic blood pressure (mm Hg) | 132.0 ± 21.0 | 129.2 ± 20.5 | 134.9 ± 21.4 | 0.186 |
| Diastolic blood pressure (mm Hg) | 77.1 ± 12.1 | 75.5 ± 13.5 | 78.8 ± 10.3 | 0.182 |
| Heart rate (beats/min) | 76.4 ± 16.9 | 81.0 ± 19.3 | 71.4 ± 12.4 | 0.007 |
| Troponin I level (ng/ml) | 17.1 ± 30.0 | 4.6 ± 5.2 | 30.2 ± 38.5 | <0.001 |
| Creatine-kinase MB level (ng/ml) | 48.9 ± 86.1 | 16.9 ± 32.9 | 81.6 ± 109.1 | <0.001 |
| Myoglobin level (ng/ml) | 226.3 ± 431.4 | 73.7 ± 34.2 | 297.1 ± 508.7 | 0.028 |
| Hypertension | 56 (62) | 22 (49) | 34 (71) | 0.032 |
| Diabetes mellitus | 17 (19) | 6 (13) | 11 (24) | 0.166 |
| Dyslipidemia | 51 (57) | 18 (40) | 33 (73) | 0.001 |
| Smoker | 31 (34) | 8 (18) | 23 (51) | 0.001 |
| Left ventricular ejection fraction (%) | 45.7 ± 13.7 | 39.8 ± 11.0 | 52.1 ± 13.6 | <0.001 |
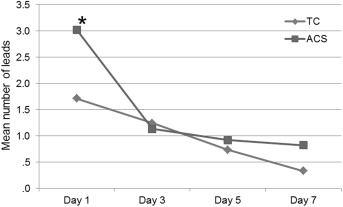
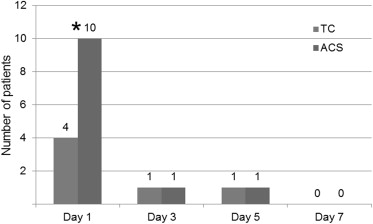
ECG findings at hospital admission are shown in Figure 1 . Prevalence of ST elevation in any of the 12 leads at baseline, according to TC or ACS diagnosis, is shown in Figure 2 .


On day 1, patients with ACS showed a significant more number of ECG leads with ST changes (excluding reciprocal ones) compared with those with TC (3.0 ± 0.5 vs 1.7 ± 0.4; p = 0.041). This difference, however, was not present anymore at days 3, 5, and 7 (p between groups = ns). A decreasing trend in the number of leads with ST changes was present over time in the whole population, as shown in Figure 3 (p within groups = 0.002), and both groups showed a similar temporal trend (p for interaction = ns).
Total sum of ST elevation decreased through day 1 to 7 in both patients with TC and those with ACS (p within groups = 0.001). Although it did not reach statistical significance, patients with TC showed a lower sum of ST elevation at admission and a linear slower decreasing trend over time, whereas patients with ACS presented a higher baseline value, which dropped at day 3 and slowly decreased in days 5 and 7 (p between groups = ns).
Among the 32 patients admitted with ST-segment elevation, reciprocal ST changes were found in 62% of patients with TC and in 25% of those with acute myocardial infarction (p = 0.027). Reciprocal changes were quite rare in both groups from day 3 onward, as shown in Figure 4 .
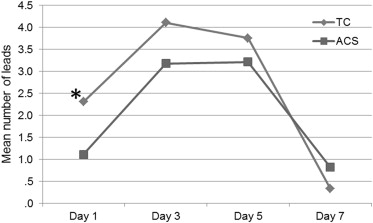
On day 1, patients with TC had a significantly more number of leads with T-wave inversion (excluding reciprocal ones) compared with matched patients with ACS (2.3 ± 0.6 vs 1.1 ± 0.3; p = 0.048). A significant reduction in the number of leads with T-wave inversion was seen in both groups over time (p within groups = 0.002), and general linear model did not account for any differences from day 3 onward (p between groups = ns; Figure 5 ).
Stay updated, free articles. Join our Telegram channel

Full access? Get Clinical Tree


