Diastolic Dysfunction in the Perioperative Setting
Gardar Sigurdsson
Aleksandr Rovner
James D. Thomas
Congestive heart failure is one of the most common diagnoses made in patients admitted to the hospital in the United States (1,2), and the mortality and morbidity of heart failure incurs high medical costs (3,4). Symptoms of heart failure can be due to systolic dysfunction, diastolic dysfunction, or both. Systolic dysfunction is characterized by decreased forward flow or decreased ejection fraction. Diastolic dysfunction is characterized by elevated left ventricular end diastolic pressure. Both systolic and diastolic dysfunctions can produce the symptoms of fatigue and pulmonary congestion (5,6,7,8,9). Diastolic dysfunction is present in virtually all patients with systolic dysfunction, however, diastolic dysfunction can present without systolic dysfunction. This is called isolated diastolic dysfunction. Up to one-third of patients admitted with heart failure symptoms will have isolated diastolic dysfunction (10,11,12). Because virtually all patients with systolic dysfunction will have diastolic dysfunction, one can state that close to all patients with symptomatic heart failure have diastolic dysfunction. This is why patient care should not exclusively concentrate on systolic dysfunction; the role of diastolic dysfunction has found increasing importance.
Until recently heart failure research has focused on systolic dysfunction, because measuring systolic function by ejection fraction is a simple and reproducible method with prognostic and therapeutic implications. Assessment of diastolic dysfunction is not as widespread due to perceived difficulty in assessing diastolic function (13). The importance of diastolic function is evident in its role as an independent prognostic factor for mortality. The severity of diastolic dysfunction has been shown to predict mortality in patients with or without systolic dysfunction in multiple studies (14,15,16,17,18,19,20,21).
Diastolic dysfunction in general practice is most commonly associated with advanced age, hypertension, and ischemic heart disease. Diastolic dysfunction is also found in idiopathic-dilated cardiomyopathy and cardiomyopathy due to restrictive disease (such as amyloidosis or glycogen storage disease), constriction (such as post thoracotomy or radiation), or hypertrophy (such as hypertrophic obstructive cardiomyopathy). In the perioperative setting diastolic dysfunction could be due to ischemia, reperfusion injury, hypothermia, cardioplegia, or pericardial effusion.
The assessment of diastolic function can be done by several different methods, including invasive left-ventricular pressure-tip catheter, echocardiographic imaging, magnetic resonance imaging, and nuclear imaging. Bedside clinical assessment of congestive heart failure by studying patient’s history and clinical exam cannot differentiate between systolic and diastolic heart failure (22).The measurement of the left-ventricular filling pressures in the cardiac catheterization laboratory provides an absolute number that is reproducible and can be followed in time. However, it is an invasive procedure and a cumbersome method to use in everyday clinical assessment. In the past two decades, the two-dimensional echocardiography has emerged as a reliable and commonly used method to assess left-ventricular diastolic function. With the help of Doppler, it became possible, albeit indirectly, to record left ventricular filling patterns. With innovations in computer software and advances in mechanical technology of Doppler echocardiography, it is possible now to diagnose diastolic dysfunction and follow it in a longitudinal fashion. This method is noninvasive and it has good reliability and reproducibility. Other methods of evaluating diastolic dysfunction have not gained common use but show some promise.
PATHOPHYSIOLOGY OF DIASTOLIC FUNCTION
Definition of Diastole
The complexity of diastolic function arises from the multiple factors with different properties that contribute to its
physiology. This is in stark contrast to systolic function where the major contribution comes from the left-ventricular myocardial contractility. These factors affecting diastolic function or left-ventricular filling include interactions between left-ventricular relaxation, regional left-ventricular pressure gradients that contribute to the suction effect, pericardial constraint, intraventricular interaction, passive properties of the myocardium, and left atrial contraction—all of these interactions combined contribute and determine how and at what pressure the ventricle fills during the diastolic period (22,23,24,25,26). The physiologic definition of diastole is the phase of the cardiac cycle that starts with the closure of the aortic valve and ends with the closure of the mitral valve (27). The hemodynamics of diastole consists of four phases: isovolumic relaxation, early filling, diastasis, and late filling (Fig. 13.1).
physiology. This is in stark contrast to systolic function where the major contribution comes from the left-ventricular myocardial contractility. These factors affecting diastolic function or left-ventricular filling include interactions between left-ventricular relaxation, regional left-ventricular pressure gradients that contribute to the suction effect, pericardial constraint, intraventricular interaction, passive properties of the myocardium, and left atrial contraction—all of these interactions combined contribute and determine how and at what pressure the ventricle fills during the diastolic period (22,23,24,25,26). The physiologic definition of diastole is the phase of the cardiac cycle that starts with the closure of the aortic valve and ends with the closure of the mitral valve (27). The hemodynamics of diastole consists of four phases: isovolumic relaxation, early filling, diastasis, and late filling (Fig. 13.1).
During isovolumic relaxation the left ventricular pressure progressively decreases in an energy-requiring process. The systemic ejection of blood stops when the left ventricular pressure decreases below the pressure in the aorta and the aortic valve closes. When the left ventricular pressure falls below that of the left atrium, the mitral valve opens and the early filling phase of diastole begins.
When the mitral valve opens, we enter the early filling phase where blood enters the left ventricle down the pressure gradient that develops as the ventricle continues to relax. This small pressure gradient from the base to apex allows the ventricle to fill at low left atrial pressure and can be measured by high fidelity catheters or Doppler echocardiography.
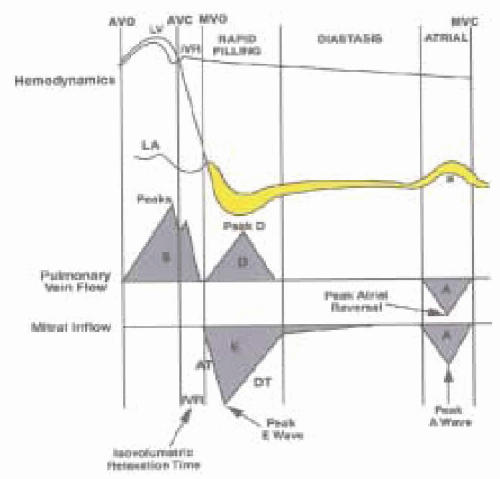 FIGURE 13.1. Diastolic function is determined by how the combination of the passive properties of tissue elastance and active ATP require relaxation of the myocytes, influence the ventricles stress/strain relationship, and, together with left ventricular geometry, determine how the ventricle responds to increased volume with increased pressure. |
There are several other interactions that produce the forces necessary to accommodate the early filling phase: the rate of decrease in LV pressure, the rate of LV relaxation, the rate of increase of LV pressure from the blood stored in the LA, passive viscoelastic properties of the myocardium, and the potential energy that is stored in the LV at end-systole (28). Also of consequence is the contribution of the filling and geometrical position of the right ventricle as well as the pericardium, which provides structural constraint on the diastolic filling of the left ventricle (29). When pressure gradients produced by the interactions of the factors described above equilibrate between the atrium and the ventricle, the blood flow is usually absent and diastasis begins.
During diastasis the ventricular volume is essentially unchanged. There are no significant pressure gradients between the atrium and the ventricle. The length of diastasis is inversely related to heart rate: As the heart rate increases, the diastasis time decreases.
The left atrial contraction contributes to left ventricular filling during the late filling phase. In a normal adult this constitutes between 15 and 30% of the blood volume (30). As the diastolic period shortens (i.e., exercise) the atrial contraction moves closer in time to the early filling phase. In normal hearts this phase contributes relatively little to the overall filling of the LV. Clinically, when the ventricle is diseased and the earlier filling becomes impaired, the atrial contribution plays an important role; patients decompensate when atrial fibrillation ensues and the atrial “kick” is lost. Heart failure is another good example: As the LV diastolic function worsens, the LA tries to aid in LV filling. Eventually the LV end-diastolic pressures rise high enough that LA cannot overcome this added “afterload,” it dilates and becomes simply a passive conduit between the pulmonary veins and LV (31).
ACTIVE PROPERTIES OF THE LEFT VENTRICLE
Relaxation of the left ventricle is an active process that occurs during isovolumic relaxation and the early filling phase. This results in a negative gradient within the left ventricle that facilitates left ventricular filling (32). The active dilatation of the left ventricle is an energy-dependent process requiring adenosine triphosphate (ATP) to allow dissociation of actin from myosin (33). Intracellular calcium also plays an important role. An increase in intracellular calcium is needed to facilitate contraction of the myocyte. A decrease of intracellular calcium is needed to facilitate relaxation (34). Elevated intracellular calcium or deficiency of ATP can lead to diastolic dysfunction.
PASSIVE PROPERTIES OF THE LEFT VENTRICLE
To appreciate the complexity of the hemodynamic interactions of the diastole, we need to address the intrinsic properties of the cardiac myocytes and the connective tissue matrix that supply the structural support to the contractile elements. These so-called passive properties of the left ventricle include stress and strain at the level of the myocardium and stiffness and compliance at the level of the ventricle.
Stress is a force that is applied to the unit of a cross-sectional area. Strain is the change in the dimension that is produced by the application of stress. Biological systems exhibit a curvilinear relationship between the applied stress and strain that is produced. The slope of that curve is referred to as elastic stiffness. The heart also has viscous elements that contribute to the passive properties. The relationship between strain and viscoelasticity depends on the rate at which stress is applied. Rapid application of stress produces a larger change in strain; the relaxation then follows a different curve in a hysteresis relationship (26,35). The clinical importance of these properties remains unclear.
The change in pressure as it relates to the change in volume (dP/dV) is referred to as ventricular stiffness. The inverse of ventricular stiffness is ventricular compliance (dV/dP). By measuring the end-diastolic pressure at different end-diastolic volumes, one can construct a pressure-volume loop of the cardiac cycle. There are two important points to consider. In states that produce high end-diastolic pressures (such as severely dilated ventricles) the pressure-volume relationship becomes mathematically complex (27). Also, it is implied that the stiffness can change by either changing the end-diastolic volume or by moving to an entirely new pressure-volume loop (Fig. 13.2) (24,26).
RELAXATION AS MEASURED BY INDICES DERIVED FROM LEFT VENTRICULAR PRESSURE DATA
As we have described above, the diastolic period consists of several phases with different hemodynamic properties; these can be directly measured from left ventricular pressure data. Because these measurements are relatively simple, a variety of indices of diastolic function based on these pressure measurements was introduced. In the following section, we will discuss three of these indices: isovolumic relaxation time, peak -dP/dt, and the time constant of relaxation.
The time that lasts between the closure of the aortic valve and opening of the mitral valve is defined as isovolumic relaxation time (IVRT); the volume of left ventricle during this phase is constant (Fig. 13.1). This time can be obtained invasively in the catheterization lab or by using echocardiography. As the disease process progresses, the ventricular relaxation slows and the IVRT will increase (36,37). However, this index has several significant limitations. Aortic or mitral valvular insufficiencies can prolong the IVRT regardless of presence or absence of the disease. Because closure of the aortic valve largely depends on the systemic diastolic pressure, changes in afterload will affect the IVRT, and because opening of the mitral valve depends on left atrial pressure, changes in preload will affect the IVRT as well.
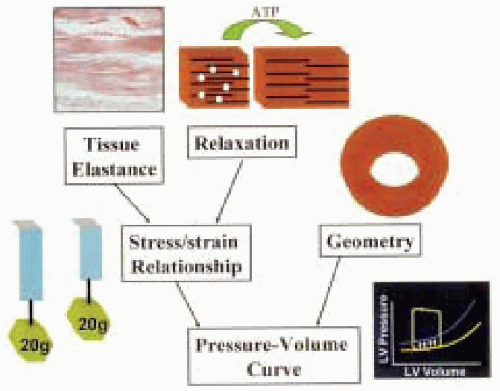 FIGURE 13.2. The hemodynamics of diastole consists of four phases: isovolumic relaxation (IVR), early filling (rapid filling), diastasis, and late filling (atrial). The schematic represents the hemodynamic pressure tracings in the aorta, left ventricle (LV), and left atrium (LA); pulsed Doppler tracings of flow in pulmonary veins; and pulsed Doppler tracing of mitral inflow measured at mitral valve tips by transesophageal echocardiographic approach. AVO, Aortic Valve Opening; AVC, Aortic Valve Closure; MVO, Mitral Valve Opening; MVC, Mitral Valve Closure. |
As the left ventricle relaxes the intraventricular pressure declines at a certain rate. The peak negative rate of this pressure drop (−dP/dt) can be measured by taking the first derivative of the left ventricular pressure tracing. With disease processes that effect diastolic function, the peak −dP/dt will be less negative. This index depends on systemic pressure and preload (38,39). Invasive techniques with high fidelity pressure transducers must be used to obtain the peak −dP/dt. One should also realize that the peak −dP/dt is taken at one point in time and does not represent the rate of pressure decline throughout the relaxation of the ventricle during diastole.
Another index of diastolic function that is based on the left ventricular pressure decline is the time constant of relaxation (tau). Usually the portion of the LV pressure decline curve that is used is between the peak −dP/dt and an arbitrarily set constant of 5 mmHg above the end-diastolic pressure. Because the rate of the ventricular
pressure drop approaches an exponential decay function, it can be inserted into the following equation: Pt = P0 * etau*t as described by Weiss and colleges (40). Taking a logarithm of both sides and then plotting Ln Pt versus time will yield a straight line. The slope of this graph will be tau. The limitations of this index are similar to the limitations that constrain −dP/dt: the need for invasive measurements and the dependents on the loading conditions (39,41,42,43). Several mathematical variations of this method have evolved with time (27). Unfortunately, there is no current mathematical model that provides a perfect description of the LV pressure decay. There is clear evidence that the rate of the LV pressure drop depends on the forces that existed in systole of the same beat (44). Complex interplay of nonuniformity of the myocardium passive properties (43), cardiac myocyte involvement (biochemical and mechanical), events that happened with previous heartbeats—including torsional and translational motion (23), and other factors make modeling difficult.
pressure drop approaches an exponential decay function, it can be inserted into the following equation: Pt = P0 * etau*t as described by Weiss and colleges (40). Taking a logarithm of both sides and then plotting Ln Pt versus time will yield a straight line. The slope of this graph will be tau. The limitations of this index are similar to the limitations that constrain −dP/dt: the need for invasive measurements and the dependents on the loading conditions (39,41,42,43). Several mathematical variations of this method have evolved with time (27). Unfortunately, there is no current mathematical model that provides a perfect description of the LV pressure decay. There is clear evidence that the rate of the LV pressure drop depends on the forces that existed in systole of the same beat (44). Complex interplay of nonuniformity of the myocardium passive properties (43), cardiac myocyte involvement (biochemical and mechanical), events that happened with previous heartbeats—including torsional and translational motion (23), and other factors make modeling difficult.
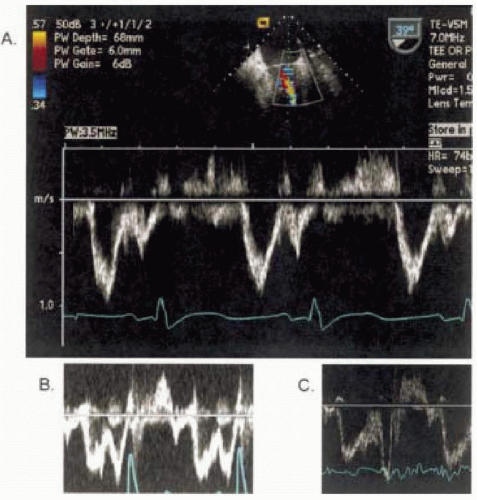 FIGURE 13.3. A: Mitral inflow is measured by pulsed Doppler at the level of mitral valve tips. The pattern is stage III diastolic dysfunction (restrictive). B: Normal pattern C: Stage I pattern of diastolic dysfunction (abnormal relaxation). |
ECHOCARDIOGRAPHIC ASSESSMENT OF DIASTOLIC DYSFUNCTION
With this background describing the factors determining the active, passive, and hemodynamic properties of the LV in the diastole, we will now describe the more conventional methods of two-dimensional Doppler patterns through the mitral valve (Fig. 13.3) and pulmonary veins (Fig. 13.4) that are used to determine the LV inflow and gauge diastolic function. Additionally we will also describe two newer methods; tissue Doppler imaging (Fig. 13.5) and color M-mode (Fig. 13.6). These new methods have gained increasing popularity and appear to be less sensitive to preload than mitral inflow and pulmonary venous flow.
MITRAL INFLOW PATTERNS
Figure 13.1 demonstrates the normal velocity curve profile obtained when a pulse Doppler is placed at the mitral
valve tips during transesophageal echocardiography. The following simple measurements are standard in evaluating diastolic function. The time between the end of the aortic flow (aortic valve closure) and beginning of the mitral inflow (mitral valve opening) represents the IVRT, the E velocity represents the early filling phase, and diastasis is next followed by the A wave that represents the atrial contraction of late filling. Increased age is related to a decrease in E-velocity and an increase in A-velocity, please see Table 13.1 for further details (45,46). As discussed above, mitral valve inflow velocities are highly dependent on the individual’s age, loading conditions, and heart rate. Diastolic function can be staged by mitral inflow into: stage I (delayed relaxation), stage II (pseudonormal), and stage III (restrictive). Note that stage II can only be diagnosed by adding a preload changing maneuver, such as Valsalva or leg raise, or by adding another measure of diastolic function, such as pulmonary venous flow, tissue Doppler imaging, or propagation velocity.
valve tips during transesophageal echocardiography. The following simple measurements are standard in evaluating diastolic function. The time between the end of the aortic flow (aortic valve closure) and beginning of the mitral inflow (mitral valve opening) represents the IVRT, the E velocity represents the early filling phase, and diastasis is next followed by the A wave that represents the atrial contraction of late filling. Increased age is related to a decrease in E-velocity and an increase in A-velocity, please see Table 13.1 for further details (45,46). As discussed above, mitral valve inflow velocities are highly dependent on the individual’s age, loading conditions, and heart rate. Diastolic function can be staged by mitral inflow into: stage I (delayed relaxation), stage II (pseudonormal), and stage III (restrictive). Note that stage II can only be diagnosed by adding a preload changing maneuver, such as Valsalva or leg raise, or by adding another measure of diastolic function, such as pulmonary venous flow, tissue Doppler imaging, or propagation velocity.
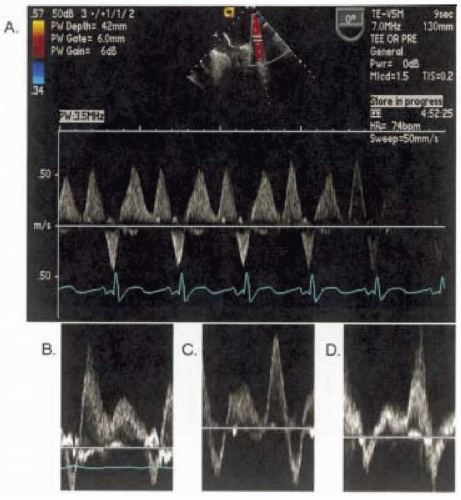 FIGURE 13.4. Pulmonary venous flow measured by pulsed Doppler at the orifice of the pulmonary vein. A: Normal pattern. B: Stage I (abnormal relaxation). C: Blunting of the S wave and large A reversal suggesting stage II (pseudonormal pattern). D: Blunting of S and large D wave suggesting stage III diastolic dysfunction (restrictive). |
Stage I: Delayed Relaxation Pattern
Diastolic function is very sensitive to cardiac homeostasis and often becomes abnormal prior to systemic manifestations of the disease. LV relaxation becomes abnormal with diseases such as hypertension and ischemia and in subjects with increased age. This state introduces specific and reproducible changes in the velocity profile that is obtained at the mitral valve inflow. Because LV relaxation is impaired, the rate of the pressure drop between the LA and LV is slowed, producing a decrease in initial hydrodynamic force that is responsible for the blood entering the LV and manifests with the decrease of the peak E velocity. Although the initial forces are decreased with relaxation, the overall filling will be prolonged continuing into late diastole, producing an increase in the deceleration time. In order to produce a constant stroke volume, during the late filling stage the atrial contraction force will increase to compensate, producing an increase in the peak A velocity.
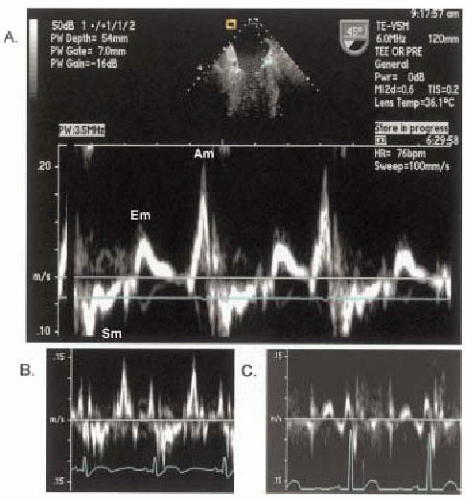 FIGURE 13.5. Tissue Doppler imaging with pulsed Doppler sampling at the level of the lateral mitral valve annulus. A: Stage I (abnormal relaxation). B: Normal with Em velocity above 10 cm/s. C: Stage II (pseudonormal) or stage III (restrictive) pattern with Em velocity below 8 cm/s. |
To summarize, as the relaxation function of LV becomes less vigorous, the peak E velocity decreases, the peak A velocity increases, the E/A ratio becomes less than one, and the deceleration time increases. These changes define delayed relaxation or stage I of diastolic dysfunction (Fig. 13.7).
Stage II: Pseudonormal Pattern
As the disease process progresses, the compensatory forces attempt to bring the LV filling to the baseline level. One way to achieve this is to increase the filling pressure or preload by increasing the operating LA pressure. At the same time as the filling pressures increase, the LV compliance decreases further secondary to the progression of the disease. A point is reached when the end-diastolic pressure is just right to increase the peak E velocity,
this will produce the inflow velocity profile resembling normal function (47) as demonstrated in Fig. 13.7. This pattern of diastolic dysfunction is called pseudonormal or stage II. This presents a major problem in the clinical setting if the diastolic function is assessed only by using mitral valve inflow pattern (48).
this will produce the inflow velocity profile resembling normal function (47) as demonstrated in Fig. 13.7. This pattern of diastolic dysfunction is called pseudonormal or stage II. This presents a major problem in the clinical setting if the diastolic function is assessed only by using mitral valve inflow pattern (48).
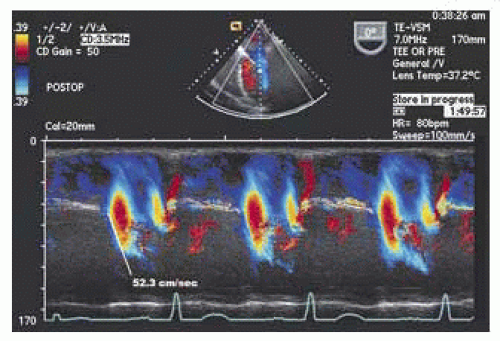 FIGURE 13.6. Color M-mode done by aligning cursor into the mitral inflow tract with lowering of the Nyquist limit (here at 0.39 m/sec) and sweep speed at 100 mm/sec. Velocity flow propagation is measured by assessing the slope of aliasing velocities from the mitral valve and at least 4 cm into the left ventricle. Here it is measured at 52.3 cm, which is normal for a subject older than 50 years. |
TABLE 13.1. Normal Values with Different Age and Different Stages of DD | ||||||||||||||||||||||||||||||||||||||||||||||||||||||||||||
|---|---|---|---|---|---|---|---|---|---|---|---|---|---|---|---|---|---|---|---|---|---|---|---|---|---|---|---|---|---|---|---|---|---|---|---|---|---|---|---|---|---|---|---|---|---|---|---|---|---|---|---|---|---|---|---|---|---|---|---|---|
| ||||||||||||||||||||||||||||||||||||||||||||||||||||||||||||
Stay updated, free articles. Join our Telegram channel

Full access? Get Clinical Tree


