Diagnostic Tests and Procedures
 Just the facts
In this chapter, you’ll learn:
♦ normal and abnormal laboratory findings
♦ tests for diagnosing cardiovascular disorders
♦ procedures used in cardiovascular care
♦ monitoring techniques for patients with cardiovascular disorders.
A look at diagnostic tests and procedures
Advances in diagnostic testing allow for earlier and easier diagnosis and treatment of cardiovascular disorders. For example, in some patients, transthoracic echocardiography—a noninvasive and risk-free test—can provide as much diagnostic information about valvular heart disease as can cardiac catheterization—an invasive and high-risk test. Monitoring and testing also help guide and evaluate treatment as well as identify complications. Before the patient undergoes testing, explain the procedure in terms he can easily understand. Make sure an informed consent form is signed, if necessary. These tests may cause anxiety, so be sure to provide emotional support.
Cardiac tests range from the relatively simple (analyzing the patient’s blood for cardiac enzymes, proteins, and clotting time) to the very sophisticated (imaging and radiographic tests which reveal a detailed image of the heart). Other cardiac tests include various forms of electrocardiography and hemodynamic monitoring.
 |
Cardiac enzymes and proteins
Analyzing cardiac enzymes and proteins (markers) is an important step in diagnosing acute myocardial infarction (MI) and in evaluating other cardiac disorders. After an MI, damaged cardiac tissue releases significant amounts of enzymes and proteins into the blood. CK-2 levels do NOT usually rise with chest pain caused by angina, pulmonary embolism (PE), or acute congestive heart failure (CHF).1,2 Specific blood tests help reveal the extent of cardiac damage and help monitor healing progress. (See Cardiac enzyme and protein patterns, page 56.)
Cardiac markers to monitor include:
• creatine kinase (CK)
• myoglobin
• troponin I and troponin T
• homocysteine
• C-reactive protein (CRP)
• B-type natriuretic peptide (BNP).
 |
Creatine kinase
CK is present in heart muscle, skeletal muscle, and brain tissue. Its isoenzyme CK-MB is found specifically in the heart muscle.
Old reliable
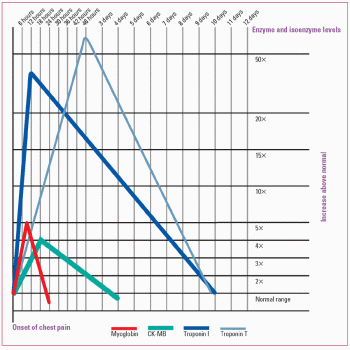
Elevated levels of CK-MB reliably indicate acute MI.3 Generally, CK-MB levels rise about 3 to 6 hours after the onset of acute MI, peak after about 12 to 18 hours, and may remain elevated for up to 72 hours. Normal CK levels are 38 to 190 units/L for men and 10 to 150 units/L for women. Remember, CK normal values are always laboratory specific so there can be a slight deviation of the normal values provided here from the normal values of your laboratory.
Nursing considerations
• Explain to the patient that the test will help confirm or rule out MI.
• Inform the patient that blood samples will be drawn at timed intervals. Be aware that muscle trauma caused by intramuscular (IM) injections can raise CK levels. Other causes may include electrical injuries, defibrillation, heart injury (e.g., from a car accident), inflammation of the heart muscle usually due to a virus (myocarditis), or open-heart surgery.
• Handle the collection tube, gently inverting 5 to 10 times to provide thorough mixing of the additives. Shaking the tube may cause hemolysis of the blood. Send the sample to the laboratory immediately.
• If a hematoma develops at the venipuncture site, apply warm soaks to help ease discomfort.
Cardiac enzyme and protein patterns
Because they’re released by damaged tissue, serum proteins and isoenzymes (catalytic proteins that vary in concentration in specific organs) can help identify the compromised organ and assess the extent of damage. After acute myocardial infarction, cardiac enzymes and proteins rise and fall in a characteristic pattern, as shown in the graph below.
 |
Myoglobin
Myoglobin, which is normally found in skeletal and cardiac muscle, functions as an oxygen-bonding muscle protein providing extra oxygen for muscles to stay at a high level of activity for longer periods of time. It’s released into the bloodstream when ischemia, trauma, and inflammation of the muscle occur. The kidneys help remove myoglobin from the body into the urine. In large amounts, myoglobin can damage the kidneys. Normal myoglobin values are 0 to 0.09 mcg/ml.4
First, but not as reliable
Rising myoglobin levels may be the first marker of cardiac injury after acute MI. Levels may rise within 30 minutes to 4 hours, peak within 6 to 7 hours, and return to baseline by 24 hours. However, because skeletal muscle damage may also cause myoglobin levels to rise, other tests (such as CK-MB or troponin) may be required to determine myocardial injury.3
Nursing considerations
• IM injections, recent angina, or cardioversion can cause elevated myoglobin levels. Handle the blood collection tube, gently inverting 5 to 10 times to provide thorough mixing of the additives. Shaking the tube may cause hemolysis of the blood. Send the sample to the laboratory immediately.
• If a hematoma develops at the venipuncture site, apply warm soaks to help ease discomfort.
Troponin I and troponin T
Troponin is a protein found in skeletal and cardiac muscles. Troponin I and troponin T, two isotypes of troponin, are found in the myocardium. Troponin T may also be found in skeletal muscle. Troponin I, however, is found only in the myocardium—in fact, it’s more specific to myocardial damage than CK, CK-MB isoenzymes, and myoglobin.3 Because troponin T levels can occur in certain muscle disorders or renal failure, they’re less specific for myocardial injury than troponin I levels are.5
Normal troponin I levels are less than 0.4 mcg/ml; normal troponin T levels are less than 0.1 mcg/ml.
Up for days
Troponin levels rise within 3 to 6 hours after myocardial damage. Troponin I peaks in 14 to 20 hours, with a return to baseline in 5 to 7 days, and troponin T peaks in 12 to 24 hours, with a return to baseline in 10 to 15 days. Because troponin levels stay elevated for a prolonged time, they can detect an infarction that occurred
several days earlier. Troponin T levels can be determined at the bedside in minutes, making them a useful tool for determining treatment in acute MI.
several days earlier. Troponin T levels can be determined at the bedside in minutes, making them a useful tool for determining treatment in acute MI.
 |
Nursing considerations
• Inform the patient that he need not restrict food or fluids before the test.
• Tell him that multiple blood samples may be drawn.
• Sustained vigorous exercise, cardiotoxic drugs such as doxorubicin (Adriamycin), renal disease, and certain surgical procedures can cause elevated troponin T levels.
• Handle the collection tube, gently inverting 5 to 10 times to provide thorough mixing of the additives. Shaking the tube may cause hemolysis of the blood. Send the sample to the laboratory immediately.
• If a hematoma develops at the venipuncture site, apply warm soaks to help ease discomfort.
Homocysteine
Homocysteine is an amino acid that’s produced by the body. High homocysteine levels can irritate blood vessels, leading to atherosclerosis. High levels can also raise low-density lipoprotein (LDL) levels and make blood clot more easily, increasing the risk of blood vessel blockages. Patients with elevated homocysteine levels may benefit from folic acid, vitamin B6, and vitamin B12 to reduce elevated homocysteine levels. Determining the homocysteine level is an optimal approach in high-risk patients. Normal homocysteine levels are less than or equal to 13 µmol/L.
Nursing considerations
• Perform a venipuncture; collect the sample in a 5-ml tube containing EDTA.
• Send the sample to the laboratory immediately to be frozen in a plastic vial on dry ice.
• If a hematoma develops at the venipuncture site, apply warm soaks to help ease discomfort.
C-reactive protein
CRP is a substance produced by the liver. A high CRP level indicates that inflammation exists at some location in the body. Other diagnostic tests are needed to determine the location of the inflammation and its cause. Elevated CRP levels can indicate such conditions as MI, angina, systemic lupus erythematosus,
postoperative infection, trauma, and heatstroke. A more sensitive CRP test, called a high-sensitivity C-reactive protein (hs-CRP) assay, is available to determine a person’s risk for heart disease. Many consider a high CRP level to be a risk factor for heart disease. Recent studies have also shown a correlation between CRP levels and coronary artery disease (CAD).3
postoperative infection, trauma, and heatstroke. A more sensitive CRP test, called a high-sensitivity C-reactive protein (hs-CRP) assay, is available to determine a person’s risk for heart disease. Many consider a high CRP level to be a risk factor for heart disease. Recent studies have also shown a correlation between CRP levels and coronary artery disease (CAD).3
 |
Nursing considerations
• Perform a venipuncture and collect the sample in a 5-ml nonanticoagulated tube.
• If a hematoma develops at the venipuncture site, apply warm soaks to help ease discomfort.
B-type natriuretic peptide
BNP is a hormone polypeptide secreted by ventricular tissues in the heart. The substance is secreted as a response to the increased ventricular volume and pressure that occur when a patient is in heart failure.
A grade for heart failure
A BNP test helps accurately diagnose and grade the severity of heart failure. A quick diagnosis of heart failure in patients who present with dyspnea is important in order to begin appropriate treatment early.
A result greater than 100 pg/ml is abnormal. The higher the number, the more likely heart failure is present and the more severe it is. Patients in renal failure, on dialysis, or waiting for dialysis may have elevated levels whether or not heart failure is present. As a result, the BNP assay is not useful in renal failure patients. Patients with right-sided heart failure (due to pulmonary hypertension, cor pulmonale, or pulmonary emboli) also have elevated levels (usually 300 to 400 pg/ml).1,6
Nursing considerations
• Perform a venipuncture and collect the sample in a 5-ml tube containing EDTA.
• If a hematoma develops at the venipuncture site, apply warm soaks to help ease discomfort.
Lipid studies
Lipid studies include triglycerides, total cholesterol, and lipoprotein fractionation. They measure lipid levels in the body and help evaluate the risk of CAD.
 |
Triglycerides
Triglycerides are the main storage form of lipids and constitute about 95% of fatty tissue. Monitoring triglyceride levels in the blood helps with early identification of hyperlipidemia and identification of patients at risk for CAD.7
What’s normal?
Triglyceride values less than 150 mg/dl are widely accepted as normal.
What’s abnormal?
Triglyceride levels between 150 and 199 mg/dl are considered borderline high. Levels between 200 and 499 mg/dl are considered high. Levels greater than 500 mg/dl are very high.
One test leads to another
Measuring cholesterol may also be necessary, because cholesterol and triglyceride levels vary independently. If both triglyceride and cholesterol levels are high, the patient is at risk for CAD.
Nursing considerations
• Because triglycerides are highly affected by a fat-containing meal, with levels rising and peaking 4 hours after ingesting a meal, tell the patient that he should abstain from food for 9 to 12 hours before the test and from alcohol for 24 hours before the test. The patient may drink water.
• Perform a venipuncture, collect a sample in a 7-ml tube containing EDTA, and send the sample to the laboratory immediately.
• Avoid prolonged venous occlusion. Remove the tourniquet within 1 minute of application.
Total cholesterol
The total serum cholesterol test measures the circulating levels of the two forms in which cholesterol appears in the body—free cholesterol and cholesterol esters.
What’s your level?
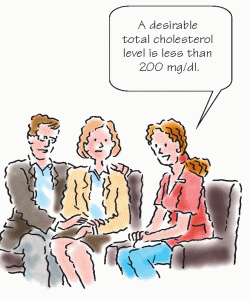
For adults, a desirable cholesterol level is less than 200 mg/dl. Levels are considered borderline high if they’re between 200 and 240 mg/dl and high if they’re greater than 240 mg/dl.7
For children ages 12 to 18, desirable levels are less than 170 mg/dl. Levels are considered high if they’re greater than 200 mg/dl.
 |
Nursing considerations
• Fasting isn’t needed for isolated total cholesterol checks or screening, but fasting is required if cholesterol is part of a lipid profile. If fasting is required, instruct the patient to abstain from food and drink for 12 hours before the test.
• Perform a venipuncture and collect the sample in a 7-ml tube containing EDTA. The patient should be in a sitting position for 5 minutes before the blood is drawn. Fingersticks can also be used for initial screening when using an automated analyzer.
• Document any drugs the patient is taking.
• Send the sample to the laboratory immediately.
Lipoprotein fractionation
Lipoprotein fractionation tests are used to isolate and measure the two types of cholesterol in blood: high-density lipoproteins (HDLs) and low-density lipoproteins (LDLs).
This is good
HDL level is inversely related to the risk of CAD—that is, the higher the HDL level, the lower the incidence of CAD. For males, normal HDL values range from 37 to 70 mg/dl; in females, from 40 to 85 mg/dl.
This isn’t
Conversely, the higher the LDL level, the higher the incidence of CAD. For individuals who don’t have CAD, desirable LDL levels are less than 130 mg/dl, borderline high levels are in the range of 130 to 159 mg/dl, and high levels are more than 160 mg/dl. For individuals who have CAD, optimal levels are less than 100 mg/dl, and higher than optimal levels are more than 100 mg/dl.
 |
Nursing considerations
• Tell the patient to maintain a normal diet for 2 weeks before the test.
• Tell him to abstain from alcohol for 24 hours before the test.
• As ordered, tell the patient to discontinue use of thyroid hormone, hormonal contraceptives, and antilipemic agents until after the test because they alter results.
• Perform a venipuncture and collect the sample in a 7-ml tube containing EDTA.
• Send the sample to the laboratory immediately to avoid spontaneous redistributions among the lipoproteins. If the sample can’t be transported immediately, refrigerate it but don’t allow it to freeze.
Coagulation tests
Partial thromboplastin time (PTT), prothrombin time (PT), and activated clotting time are tests that measure clotting time. They’re used to measure response to treatment as well as to screen for clotting disorders.
Partial thromboplastin time
The PTT test evaluates all the clotting factors of the intrinsic pathway, except platelets. It’s done by measuring the time it takes a clot to form after adding calcium and phospholipid emulsion to a plasma sample. Normally, a clot forms 21 to 35 seconds after the reagents are added.
The PTT test also helps monitor a patient’s response to heparin therapy. For a patient on anticoagulant therapy, check with the attending doctor to find out what PTT test results to expect.
Nursing considerations
• Tell the patient receiving heparin therapy that this test may be repeated at regular intervals to assess response to treatment.
• Perform a venipuncture and collect the sample in a 7-ml tube containing sodium citrate.
• Completely fill the collection tube, invert it gently several times, and send it to the laboratory on ice.
• For a patient on anticoagulant therapy, additional pressure may be needed at the venipuncture site to control bleeding.
 |
Prothrombin time
Prothrombin, or factor II, is a plasma protein produced by the liver. The PT test (also known as pro time) measures the time required for a clot to form in a citrated plasma sample after the addition of calcium ions and tissue thromboplastin (factor III).
Excellent choice, sir!
The PT test is an excellent screening procedure for overall evaluation of extrinsic coagulation factors V, VII, and X and of prothrombin and fibrinogen. It’s also the test of choice for monitoring oral anticoagulant therapy.
Count to 10 (or more)
Normally, PT ranges from 10 to 14 seconds. In a patient receiving warfarin (Coumadin) therapy, the goal of treatment is to attain
a PT level 1.5 to 2 times the normal control value—for example, a level of 15 to 20 seconds. (See Understanding the INR.)
a PT level 1.5 to 2 times the normal control value—for example, a level of 15 to 20 seconds. (See Understanding the INR.)
 Advice from the experts
Understanding the INR
The International Normalized Ratio (INR) system is generally viewed as the best means of standardizing measurement of prothrombin time to monitor oral anticoagulant therapy.
Guidelines for patients receiving warfarin (Coumadin) therapy recommend an INR result of 2.0 to 3.0. For patients with mechanical prosthetic heart valves, an INR result of 2.5 to 3.5 is recommended.
What’s the problem?
Increased INR values may indicate disseminated intravascular coagulation, cirrhosis, hepatitis, vitamin K deficiency, salicylate intoxication, uncontrolled oral anticoagulation caused by dietary indiscretions, or massive blood transfusion.
Foods rich in vitamin K include beef liver, broccoli, Brussels sprouts, cabbage, collard greens, endive, kale, lettuce, mustard greens, parsley, soy beans, spinach, Swiss chard, turnip greens, watercress, and other green leafy vegetables. Moderate to high levels of vitamin K are also found in other foods such as asparagus, avocados, dill pickles, green peas, green tea, canola oil, margarine, mayonnaise, olive oil, and soybean oil. The diet in general should remain consistent, as other foods containing little or no vitamin K such as mangos and soy milk have been reported to interact with warfarin. Patients should also consider avoiding or limiting the consumption of cranberry juice, pomegranate juice, black currant juice, and black currant seed oil.
Nursing considerations
• Check the patient’s history for use of medications that may affect test results, such as vitamin K or antibiotics.
• Perform a venipuncture and collect the sample in a 7-ml siliconized tube.
• Completely fill the collection tube and invert it gently several times to adequately mix the sample and anticoagulant. If the tube isn’t filled to the correct volume, an excess of citrate appears in the sample.
 |
Activated clotting time
Activated clotting time, or automated coagulation time, measures the time it takes whole blood to clot.
Out-of-body experiences
This test is commonly performed during procedures that require extracorporeal (occurring outside the body) circulation, such as cardiopulmonary bypass, ultrafiltration, hemodialysis, and extracorporeal membrane oxygenation. It is also commonly used in cardiac and radiological invasive procedures such as stent angioplasty or ablations.
Nursing considerations
• Explain to the patient that the test requires a blood sample that’s usually drawn from an existing vascular access site; therefore, no venipuncture is necessary.
• Explain that two samples will be drawn. The first one will be discarded so that heparin in the tubing doesn’t interfere with the results.
• If the sample is drawn from a line with a continuous infusion, stop the infusion before drawing the sample.
• Turn on the activated clotting time unit by inserting a cuvette, and wait for the signal to add the blood.
• Withdraw 5 to 10 ml of blood from the line and discard it.
• Withdraw a clean sample of blood, and place in the cuvette inside the activated clotting time unit.
• Flush the vascular access site according to your facility’s protocol.
 |
Electrocardiography
The heart’s electrical conduction system can be recorded numerous ways, but the most common methods are a 12-lead electrocardiogram (ECG), continuous cardiac monitoring, an exercise ECG, Holter monitoring, and electrophysiology studies (EPS). (See How to read any ECG: An 8-step guide, pages 66 and 67.)
12-Lead electrocardiogram
The 12-lead ECG measures the heart’s electrical activity and records it as waveforms. It’s one of the most valuable and commonly used diagnostic tools.3
 |
A test with 12 views
The standard 12-lead ECG uses a series of electrodes placed on the patient’s extremities and chest wall to assess the heart from 12 different views (leads). The 12 leads include three bipolar limb leads (I, II, and III), three unipolar augmented limb leads (aVR, aVL, and aVF), and six unipolar precordial limb leads (V1 to V6). The limb leads and augmented leads show the heart from the frontal plane. The precordial leads show the heart from the horizontal plane.
ECG can be used to identify myocardial ischemia and infarction, rhythm and conduction disturbances, chamber enlargement, electrolyte imbalances, and drug toxicity.
Nursing considerations
• Use a systematic approach to interpret the ECG recording. (See Normal ECG waveforms, page 68.) Compare the patient’s previous ECG with the current one, if available. Doing so will help you identify changes.
Waves of waves
• P waves should be upright; however, they may be inverted in lead aVR or biphasic or inverted in leads III, aVL, and V1.
• PR intervals should always be constant, like QRS-complex durations.
• QRS-complex deflections vary in different leads. Observe for pathologic Q waves, which are defined as one-third the height of the R wave and must be present in contiguous or groups of leads representing the different walls of the heart.
• ST segments should be isoelectric or have minimal deviation.
• ST-segment elevation greater than 1 mm above the baseline and ST-segment depression greater than 0.5 mm below the baseline are considered abnormal and must be present in contiguous leads. Leads facing toward an injured area have ST-segment elevations, and leads facing away show ST-segment depressions.
Don’t sound the alarm—yet
• The T wave normally deflects upward in leads I, II, and V3 through V6. It’s inverted in lead aVR and variable in the other leads. T-wave changes have many causes and aren’t always a reason for alarm. Excessively tall, flat, or inverted T waves occurring with such symptoms as chest pain may indicate ischemia.
• A normal Q wave generally has a duration less than 0.04 second. An abnormal Q wave has a duration of 0.04 second or more, a depth greater than 4 mm, or a height one-fourth of the R wave.
Abnormal Q waves indicate myocardial necrosis, developing when depolarization can’t follow its normal path because of damaged tissue in the area.
Abnormal Q waves indicate myocardial necrosis, developing when depolarization can’t follow its normal path because of damaged tissue in the area.
How to read any ECG: An 8-step guide
An electrocardiogram (ECG) waveform has three basic elements: a P wave, a QRS complex, and a T wave. They’re joined by five other useful diagnostic elements: the PR interval, the U wave, the ST segment, the J point, and the QT interval. The diagram to the right shows how these elements are related.
Getting in step
This 8-step guide will enable you to read any ECG.
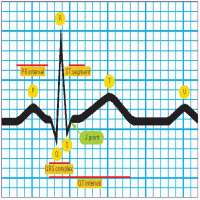 |
Step 1: Evaluate the P wave
Observe the P wave’s size, shape, and location in the waveform. If the P wave consistently precedes the QRS complex, the sinoatrial (SA) node is initiating the electrical impulse, as it should be.
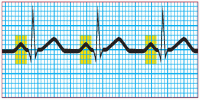 |
Step 2: Evaluate the atrial rhythm
The P wave should occur at regular intervals, with only small variations associated with respiration. Using a pair of calipers, you can easily measure the interval between P waves—the P-P interval. Compare the P-P intervals in several ECG cycles. Make sure the calipers are set at the same point—at the beginning of the wave or on its peak. Instead of lifting the calipers, rotate one of its legs to the next P wave to ensure accurate measurements.
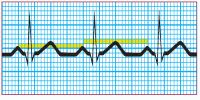 |
Step 3: Determine the atrial rate
To determine the atrial rate quickly, count the number of P waves in two 3-second segments. Multiply this number by 10. For a more accurate determination, count the number of small squares between two P waves, using either the apex of the wave or the initial upstroke of the wave. Each small square equals 0.04 second; 1,500 squares equal 1 minute (0.04 × 1,500 = 60 seconds). So, divide 1,500 by the number of squares you counted between the P waves. This calculation gives you the atrial rate—the number of contractions per minute.
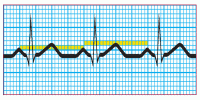 |
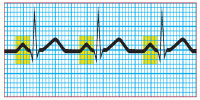
Step 4: Calculate the duration of the PR interval
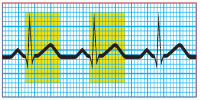
Count the number of small squares between the beginning of the P wave and the beginning of the QRS complex. Multiply the number of squares by 0.04 second. The normal interval is between 0.12 and 0.20 second, or between 3 and 5 small squares. A wider interval indicates delayed conduction of the impulse through the atrioventricular node to the ventricles, also commonly known as heart block. A short PR interval indicates that the impulse originated in an area other than the SA node.
 |
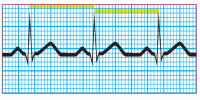
Step 5: Evaluate the ventricular rhythm
Use the calipers to measure the R-R intervals. Remember to place the calipers on the same point of the QRS complex. If the R-R intervals remain consistent, the ventricular rhythm is regular.
 |
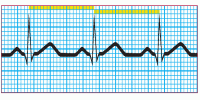
Step 6: Determine the ventricular rate
To determine the ventricular rate, use the same formula as in step 3. In this case, however, count the number of small squares between two R waves to do the calculation. Also, check that the QRS complex is shaped appropriately for the lead you’re monitoring.
 |
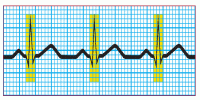
Step 7: Calculate the duration of the QRS complex
Count the number of squares between the beginning and the end of the QRS complex, and multiply by 0.04 second. A normal QRS complex is less than 0.12 second, or less than 3 small squares wide. Some references specify 0.06 to 0.10 second as the normal duration of the QRS complex.
 |
Step 8: Calculate the duration of the QT interval
Count the number of squares from the beginning of the QRS complex to the end of the T wave. Multiply this number by 0.04 second. The normal range is 0.36 to 0.44 second, or 9 to 11 small squares wide.
The QT interval, as well as the corrected QT interval, are important in the diagnosis of long QT syndrome and short QT syndrome. The QT interval varies based on the heart rate, and various correction factors have been developed to correct the QT interval for the heart rate. The most commonly used method for correcting the QT interval for rate is the one formulated by Bazett and published in 1920.8
 |
Normal ECG waveforms
Each of the 12 standard leads of an electrocardiogram (ECG) takes a different view of heart activity, and each generates its own characteristic tracing. The tracings shown here represent a normal heart rhythm viewed from each of the 12 leads. Keep in mind:
• An upward (positive) deflection indicates that the wave of depolarization flows toward the positive electrode.
• A downward (negative) deflection indicates that the wave of depolarization flows away from the positive electrode.
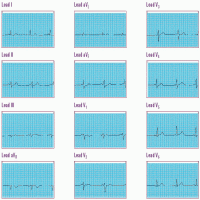 |
• An equally positive and negative (biphasic) deflection indicates that the wave of depolarization flows perpendicularly to the positive electrode.
Each lead represents a picture of a different anatomic area; when you find abnormal tracings, compare information from the different leads to pinpoint areas of cardiac damage.
• Remember that aVR normally has a large Q wave, so disregard this lead when searching for abnormal Q waves.
Continuous cardiac monitoring
Stay updated, free articles. Join our Telegram channel

Full access? Get Clinical Tree


