|
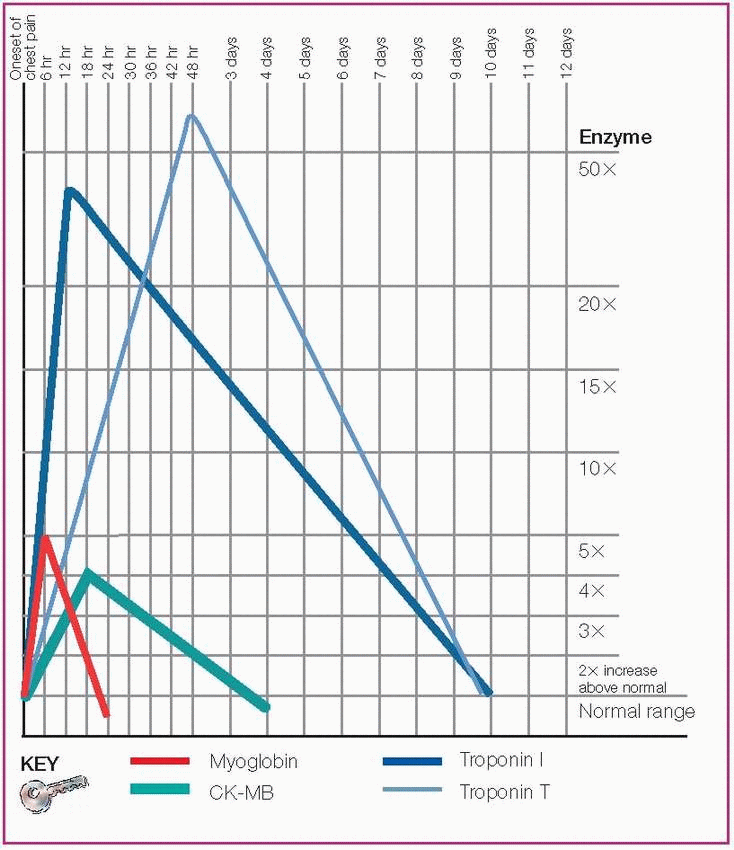
Myoglobin
Elevated
First marker of cardiac injury after acute MI
Found in skeletal muscle
Creatine kinase (CK) and CK-MB
Both return to normal quickly
CK-MB most reliable when reported as a percentage of total CK (relative index)
Found in cardiac muscle (CK-MB) and skeletal muscle (CK)
Troponin I
Isotype of troponin found only in myocardium
Elevated
Specific to myocardial damage
Troponin T
Isotype of troponin that’s less specific to myocardial damage (can indicate renal failure)
Elevated
Determined quickly at bedside
|

Normal value: 0 to 0.09 mcg/ml
Rises within 30 minutes to 4 hours
Peaks within 6 to 10 hours
Returns to baseline by 24 hours
Normal value: 38 to 190 units/L for men; 10 to 150 units/L for women
Rises within 4 to 8 hours
Peaks in 12 to 24 hours
May remain elevated for up to 96 hours
Normal value: Less than
0.4 mcg/ml (may vary depending on the laboratory)
Rises within 4 to 6 hours
Peaks in 12 hours
Returns to baseline in 3 to 10 days
|
Normal value: < 13 umol/L
Excess levels
Irritate blood vessels, leading to atherosclerosis
Raise low-density lipoprotein (LDL) levels
Make blood clot more easily
Normal value: 0.1 to 0.3 mg/dl
Excess levels: May indicate increased risk of coronary artery disease (CAD)
Normal value: < 150 mg/dl
Excess levels: Help with early identification of hyperlipidemia and identification of patients at risk for CAD
Normal value: < 200 mg/dl for adults; < 170 mg/dl for children and adolescents
Excess levels: May indicate hereditary lipid disorders, CAD
|
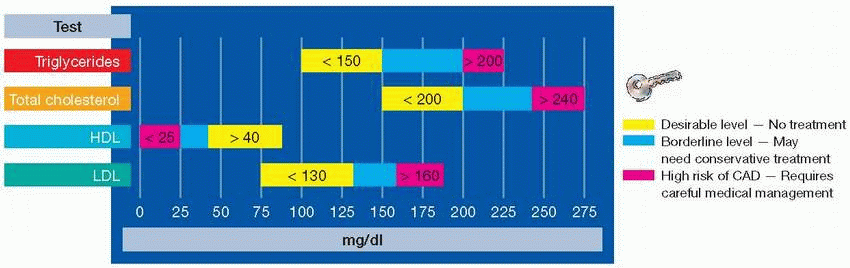
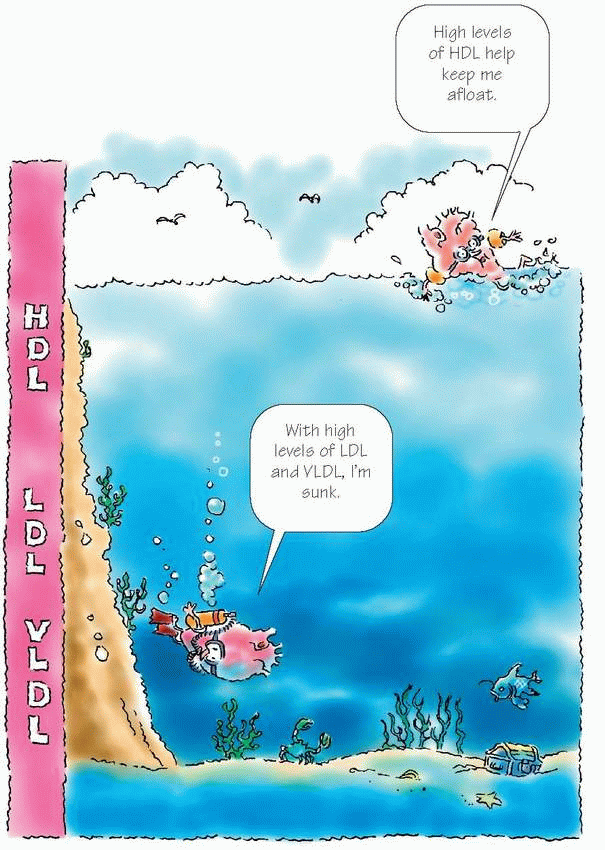
Primarily protein
Test measures the actual amount in the blood
The higher the level, the lower the risk of CAD
Normal values for males: 35 to
65 mg/dl; for females, 35 to 80 mg/dl
Mainly cholesterol
Equal to total cholesterol – HDL cholesterol – VLDL cholesterol (when triglyceride level is below 400 mg/dl)
The higher the LDL level, the higher the risk of CAD
Normal levels for individuals without CAD, < 130 mg/dl
Optimal levels for individuals with CAD, < 100 mg/dl
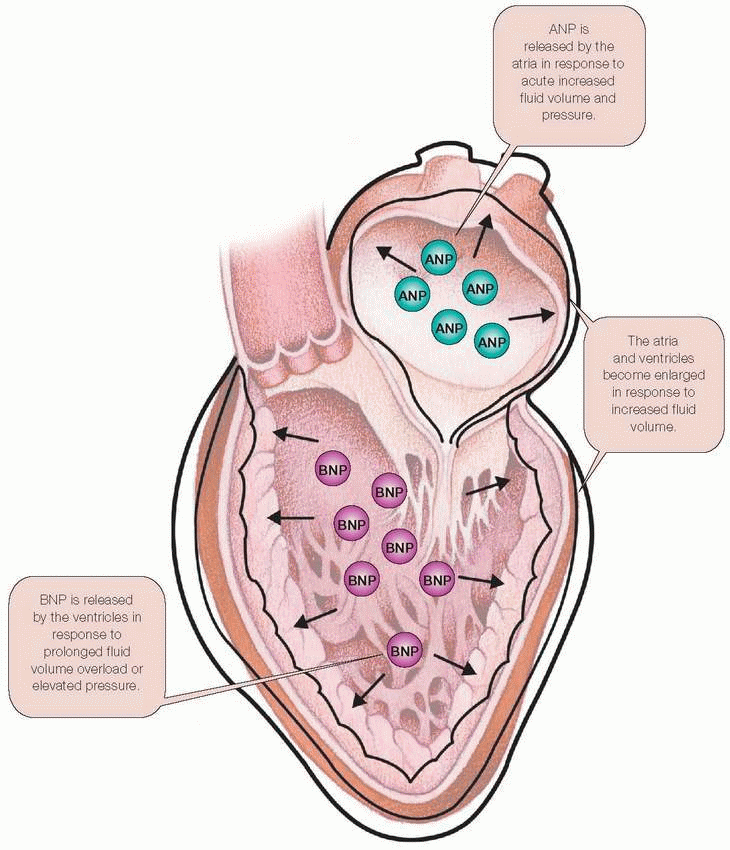
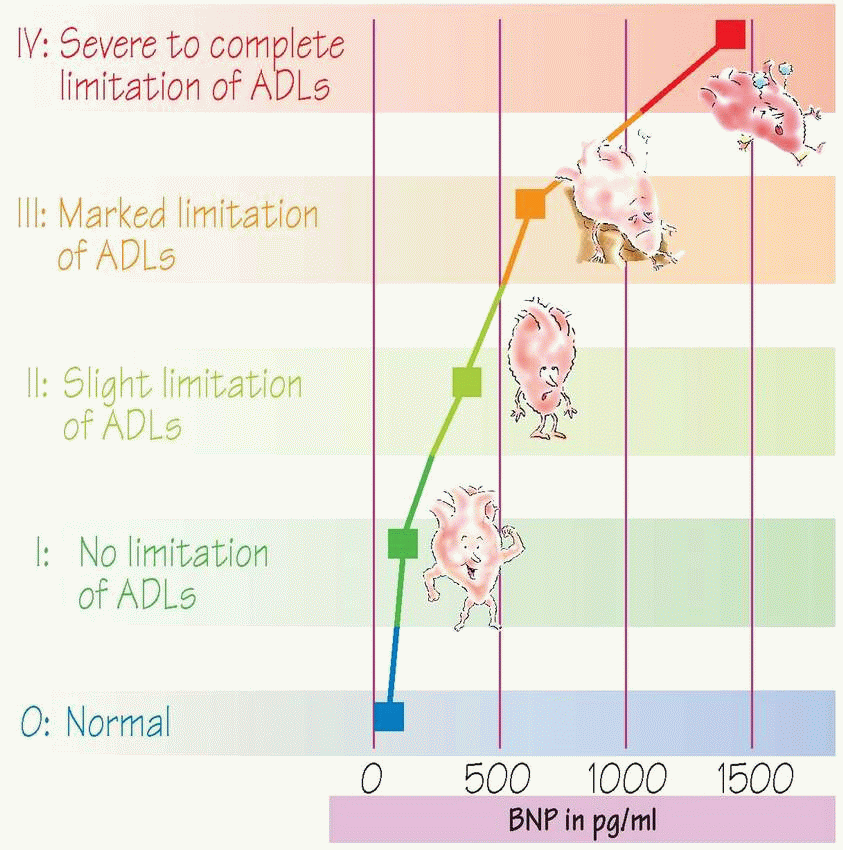
Found in ventricular tissue
Helps accurately diagnose and grade heart failure severity
Normal value: < 100 pg/ml
|
|

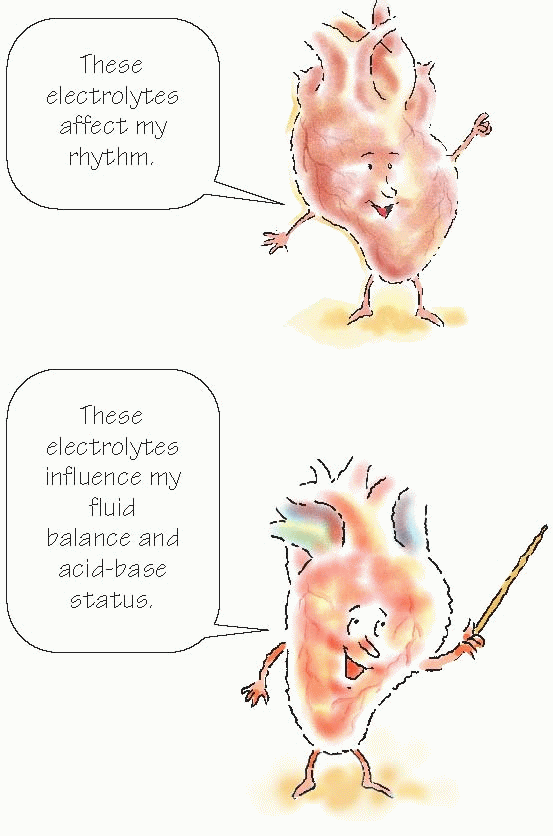
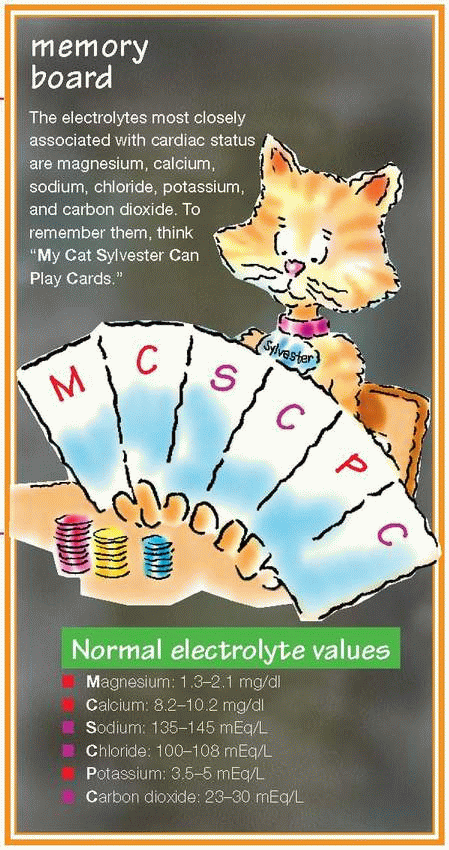
Most critical value
Has narrow therapeutic range
Imbalances cause life-threatening arrhythmias
Affected by diuretics, penicillin G, some nonsteroidal anti-inflammatory drugs.
High values cause cardiac toxicity and arrhythmias
Elevations commonly caused by cancer or hyperparathyroidism
High values cause ECG changes, ventricular tachycardia, and ventricular fibrillation
Low values cause ECG changes, bradycardia, and hypotension
Maintains osmotic pressure, acid-base balance, and nerve impulse transmission
Levels decreased in severe heart failure
Decreased by diuretics, high triglycerides, and low blood protein
Partners with sodium to maintain fluid and acid-base balance
Low levels in heart failure and metabolic acidosis
Primarily made up of bicarbonate
Regulated by the kidneys
Levels lowered by thiazide diuretics
|
Test | Action | Clinical uses | Location performed | Normal range | Therapeutic ranges | Panic value |
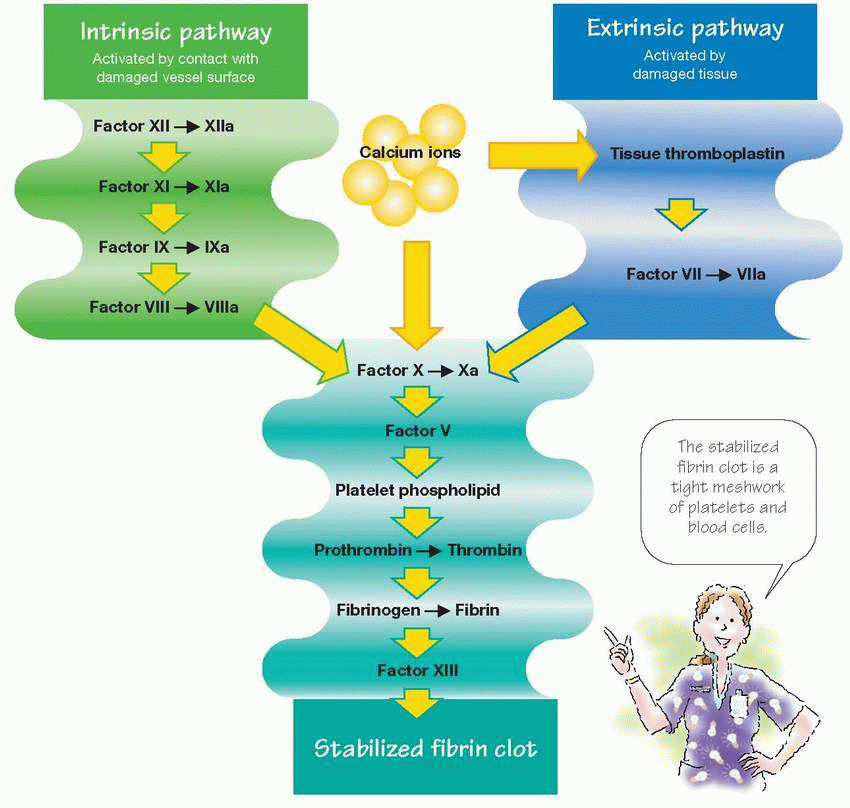
ACT | Measures overall coagulation activity | ♥ Evaluates effects of high dose heparin therapy during cardiac procedures | Bedside | 70 to 120 seconds | 2 times normal range | Unknown |
Bleeding time | Determines platelet function abnormalities | ♥ Screens for platelet abnormalities before or during surgery ♥ Used to diagnose von Willebrand’s disease, vascular disorders, hemostatic dysfunctions | Bedside | 3 to 10 minutes | Unknown | > 15 minutes |
aPTT | Measures defects in intrinsic and common clotting pathways | ♥ Evaluates effects of heparin therapy ♥ Assesses overall coagulation system | Laboratory | 21 to 35 seconds | 2 to 2.5 times normal range | > 70 seconds |
PT | Directly measures deficits in extrinsic and common clotting pathways | ♥ Evaluates effects of coumar therapies ♥ Assesses for vitamin K deficiency ♥ Used to diagnose liver failure | Laboratory | 11 to 13 seconds | 2 to 2.5 times normal range | > 30 seconds |
Stay updated, free articles. Join our Telegram channel

Full access? Get Clinical Tree


