Devices
Wolfram Schmidt
Klaus-Peter Schmitz
Endovascular therapy has a relatively short but rich history, characterized by the work of strong individuals and marked by remarkable events.1,2
Today, to the uninitiated, endovascular instrumentation can easily be mistaken for a simple matter-of-course tool of the trade. However, today’s facile, lower-risk instruments required years of development, employing the integrated professional expertise of designers, material and production specialists, biologists, and physicians in an increasingly high-tech industrial environment. On the path from an idea to a finished product, efficient design, flawless production, and excellent quality must coincide. And since the quality of a product is never the result of a fortunate coincidence, it can and has to be measured to ensure safe and efficacious medical application.
The sheer number of endovascular devices available prevents us from providing a comprehensive discussion of all of them in this chapter. We have, therefore, selected dilatation balloon catheters and stents for coronary and peripheral vascular applications as representative examples providing insights into the objective performance and quality assessment of endovascular instrumentation. Specifically, we review and discuss:
Performance parameters measured by in vitro laboratory tests
Methods of measuring these parameters
Typical results
The impact of specific results on clinical applications
In the past, a number of attempts have been made to measure, validate, and simulate performance parameters, and some of these methods and results have been published.3,4,5,6,7,8,9,10,11,12,13,14,15,16,17 It is not our intention to consider all of these tests, but rather to inform the reader why specific properties should be measured and how the results should be interpreted.
Dilatation Balloon Catheters
Performance Parameters
High-pressure, dilatation balloon catheters are designed to dilate or to reopen narrowed or occluded vessels by inserting and inflating a balloon within the lesion using internal hydraulic pressure. This simple operating principle determines the main performance characteristics and requirements of any angioplasty balloon catheter, including:
Low entry and crossing profile of the balloon catheter for optimum tracking and crossing
Short inflation and deflation time to avoid ischemic complications
Optimum refolding characteristics to avoid traumatization or stent damage
Predictable and low balloon compliance to allow precise diameter sizing
High balloon-burst strength for high-pressure dilatations
Low bending stiffness for easy tracking of curved vessels
These parameters must be integrated into several complex functional parameters such as trackability (tracking ability), crossability (crossing ability), and pushability (pushing ability) to characterize the clinical performance of the final product.
Rapid exchange (RX) catheters have a guidewire lumen only in their distal part. This means the catheter produces less friction on the guidewire, but also provides less support than the traditional over-the-wire (OTW) systems, which contain a guidewire lumen throughout the entire length of their shaft. A typical RX balloon dilatation catheter design is shown in Figure 5-1.
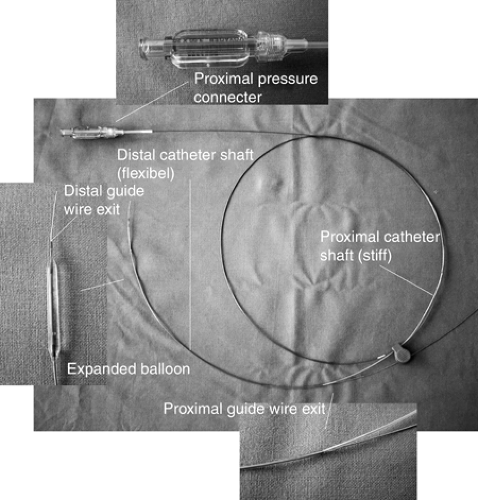 FIGURE 5-1. Typical PTCA balloon catheter system with description of the essential parts of a rapid exchange catheter (Guidant Voyager). PTCA, percutaneous transluminal coronary angioplasty. |
Test Methods
Profile
Several profiles of a balloon catheter can be measured to characterize its performance, as illustrated in Figure 5-2. The crossing profile is the most important of these and is commonly defined as the largest diameter in the balloon region of the dilatation catheter. To position the dilatation balloon safely across tight lesions, the lowest possible profiles are required. To cross extremely tight and long lesions, both the entry and the crossing profiles must be low. Low profiles are also desirable to avoid luminal obstructions, which could potentially result in myocardial ischemia in time-consuming procedures.
The maximum profile of catheters can be measured using a calibrated aperture plate. Using this method, the maximum diameter of the folded balloon can be assessed, as can the compressibility of the balloon material required for insertion into tight lesions, therefore providing a combined measurement of the geometry and compressibility of the dilatation balloon in its deflated and folded state.
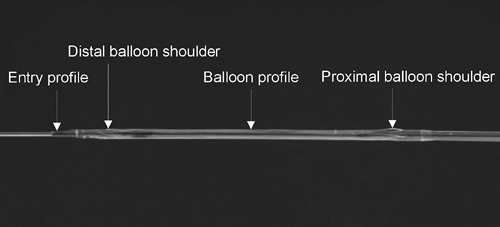 FIGURE 5-2. Folded balloon with relevant profiles as indicated. |
The pinhole diameters of the aperture plate used for this measurement are adjusted to the typical dimensions of the balloon catheters. The accuracy of these profile measurements depends on the accuracy of the dimension of the pinholes and on a fine gradation of the diameters. Steps of 0.05 mm appear to provide sufficiently accurate measurements (Fig. 5-3).
To mimic the behavior of the balloons during in vivo vascular applications, it is necessary to conduct the measurement in an aqueous environment at 37°C. Because of the strong dependence of polymer characteristics on temperature, in vivo conditions should be simulated as close as possible. However, no long-term sample conditioning is needed of the kind required in the measurement of mechanical parameters of polymers according to technical standards.18,19 Device testing is intended to simulate conditions for clinical use rather than to measure physical material constants. Since, in most cases, vascular interventions should be finished within a space of minutes, constant material properties of small devices such as balloon catheters are typically assumed to be achieved within 5 minutes of conditioning.
The measurements are performed by starting with the largest pinhole diameter and continuing with smaller pinhole diameters until the balloon cannot pass through the aperture. Profile data of the distal and proximal balloon shoulders frequently represent the highest profiles of the entire dilatation balloon, thus corresponding to the crossing profile of the balloon catheter.
Current percutaneous transluminal coronary angioplasty (PTCA) catheter balloons usually have maximum diameters of about 1.00 mm, whereas percutaneous transluminal angioplasty (PTA) balloons may be in the order of 2.00 mm, depending on the design for specific vascular regions (e.g., renal, iliacal, carotid). For all vascular applications, there is a trend towards decreasing profiles and smaller sizes to allow less traumatic dilatations of increasingly complex lesions.
A more accurate and user-independent profile measurement can be made using a noncontact diameter measurement. For this application, laser scanner technology provides the most accurate and objective results because mechanical interference can be completely avoided. However, tactile distance sensors may also be used if the conditions of measurements are well defined, in particular the contact force.
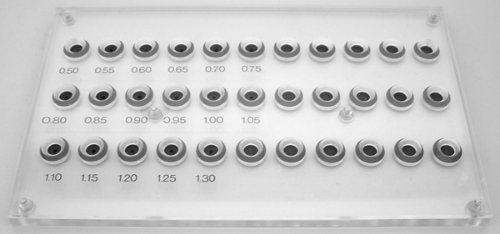 FIGURE 5-3. Aperture plate with 17 pinholes from 0.50 up to 1.30 mm (diameter steps of 0.05 mm). |
Figure 5-4 illustrates the operating principle of a two-axis laser scanner. The test specimen is situated in the center of the two-axis laser measurement head. Each axis laser scanner measures the dimension in the x or y projection of the specimen in the plane of the measurement (dimension z). Using this experimental setup the measured diameter values dx and dy are recorded and the root mean square (RMS) is calculated, assuming a cylindrical shape of the folded balloon. Deviations from this assumption can be assessed by considering the diameter difference dx – dy. The profile measurement is repeated automatically for consecutive adjacent z-planes to achieve a profile function along the long axis of the catheter.
A laser scanning device of this kind can typically operate at a measurement range of 0.1 to 30 mm with an accuracy of ±0.01 mm and a resolution of ±0.001 mm. The sensitivity in the z direction should be high to allow for measurements of changing profiles and structures. A thickness of the effective z plane of 0.2 mm can be reached. Additional optical adaptation of the system is required for measuring the specimen in a water bath because of additional refraction and scattering effects.
Typical results of profile measurements can be seen in Table 5-1 and Figure 5-5. Comparing the maximum diameters resulting from the aperture plate measurement with the noncontact laser scanner data, it is clear that most of the tested dilatation balloons can be pushed through smaller pinholes than would be assumed from noncontact measurements. In some cases the balloon shoulders are compressed by nearly 0.2 mm if maximum push is applied. However, the laser measurements are completely free of any manipulation and thus represent an excellent method for objective comparison of devices.
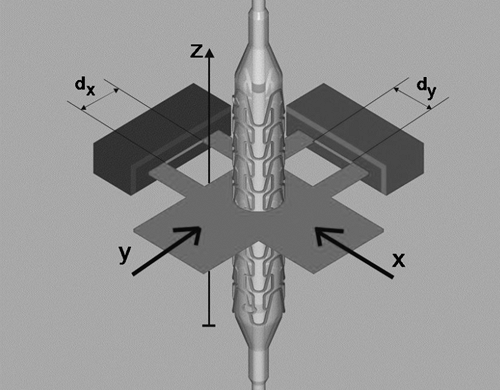 FIGURE 5-4. Schematic drawing of the setup for measuring the diameter of a catheter (here with a mounted stent) using a two-axis laser scanner. |
TABLE 5-1. Maximum Profile of PTCA Balloon Catheters, Measured Using an Aperture Plate (δd = 0.05 mm) | |||||||||||||||||||||
|---|---|---|---|---|---|---|---|---|---|---|---|---|---|---|---|---|---|---|---|---|---|
| |||||||||||||||||||||
Inflation and Deflation Time
Inflation of a dilatation balloon within a narrowed, but not completely occluded, blood vessel results in ischemia of the dependent tissue. To keep the ischemic time short, the operator must retain full control over the obstruction time of the target vessel, represented by a sum of the time required to transmit the pressure in the hand pump mounted at the proximal side of the catheter to the inside of the balloon, time for balloon inflation, and deflation time.
Physically, the dilatation balloon is expanded by pumping a specific volume of liquid (mixture of normal saline and contrast agent) under pressure into the limited volume of the noncompliant balloon. The liquid flow (volume per unit time) between the pump and the balloon is driven by the pressure difference. The time needed to fill or to fully evacuate this volume, termed the inflation and deflation times, respectively, is commonly used as the relevant parameter to compare dilatation balloons. The flow required to fill or to evacuate the balloon is mainly restricted by the flow resistance R of the hypotube of the shaft connecting the hub and the balloon. R is determined by the viscosity of the liquid η and the inner radius r and length l of the hypotube, described by Poiseuille’s law applicable to the laminar flow conditions:

On the basis of this equation, it is clear that the radius r of the tubing is the major determinant of resistance (raised to the fourth power). Low-caliber hypotubes mean long inflation or deflation time, thus placing limits on decreasing catheter shaft profiles. The inflation and deflation times depend, furthermore, on the volume of the balloon. However, because the volume of balloons of comparable sizes is similar, this is not a useful measurement in balloon comparisons.
To measure the inflation and deflation time of the balloon, the pressure and the test liquid must be well defined. It is useful to adjust nominal pressure (NP) conditions, as specified by the manufacturer. Thus, for balloon inflation, a clinically relevant mixture of saline and x-ray contrast agent (e.g., 1:1) should be used. In addition, the end points of balloon filling (inflation) or emptying (deflation) must be exactly defined. In practice, these points are those at which no further changes in the outer balloon shape occur; objective measurements of the outer contour can precisely define these points. These shape measurements can be made by tactile or noncontact sensors (e.g., optical, magnetic, capacitive distance sensors). In Figure 5-6 a setup is shown where the state of the balloon is measured by a capacitive distance sensor. Figure 5-7 shows typical results of deflation time measurements.
Inflation and deflation times, however, do not fully describe the extent of flow obstruction and the risk posed by ischemia. Even if the balloon is folded or refolded after expansion, the
deflated balloon remains within the lumen and obstructs the blood flow. Therefore, to minimize the residual obstruction and to avoid vessel wall damage by “flaring” of unfolded balloon parts on retraction, the geometric refolding characteristics of a balloon after deployment are also important. The lowest cross-sectional area and smooth profile of the refolded balloon is associated with the least blood-flow obstruction and avoids vessel traumatization and stent damage on withdrawal.
deflated balloon remains within the lumen and obstructs the blood flow. Therefore, to minimize the residual obstruction and to avoid vessel wall damage by “flaring” of unfolded balloon parts on retraction, the geometric refolding characteristics of a balloon after deployment are also important. The lowest cross-sectional area and smooth profile of the refolded balloon is associated with the least blood-flow obstruction and avoids vessel traumatization and stent damage on withdrawal.
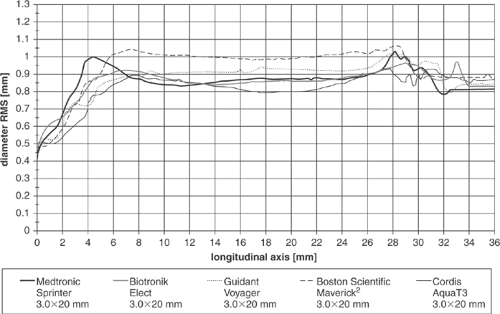 FIGURE 5-5. Distal profile of PTCA balloon catheters, noncontact measurement of RMS values using a two-axis laser scanner (ODAC 32XY, Zumbach Electronic). PTCA, percutaneous transluminal coronary angioplasty; RMS, root mean square. |
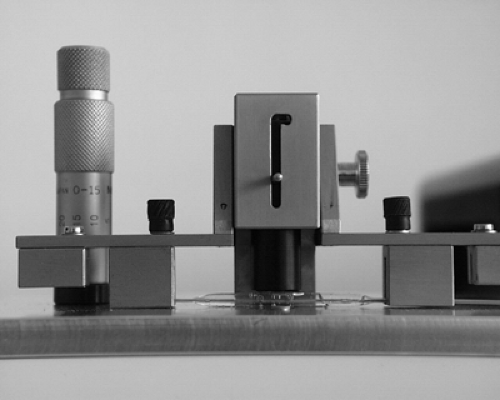 FIGURE 5-6. View of a test setup with inflated balloon; indication of balloon deflation by a tactile sensor. |
Balloon Compliance
Compliance of balloon catheters C is defined as the change in balloon diameter (Δd) for a given change in balloon pressure (Δp). High-pressure balloons for PTCA/PTA therapy have extremely low compliance compared with low-pressure balloons commonly used for diagnostic purposes. However, even when high-pressure balloons are sometimes termed “noncompliant,” measurable diameter compliance always exists. Compliance of a specific balloon can be either indicated as a percentage increase in diameter per bar, or listed as a table of pressures and corresponding balloon diameters. The first is useful for classification of balloons as noncompliant or semicompliant, whereas the latter is usually given by the manufacturer for each device as the compliance chart.
Balloon compliance can be measured using the setup for profile measurement shown above in Figure 5-4. This setup must additionally include the means to adjust and measure balloon pressure up to at least 20 bar. To achieve this, a computer-controlled piston pump and a pressure sensor are added. It is important to use a basin of temperate water (37°C) for this measurement, because the elastic modulus of the polymeric balloon material strongly depends on temperature. The technical setup for compliance measurements is shown in Figure 5-8. Figure 5-9 demonstrates the compliance of five different PTCA dilatation balloons.
To calculate compliance, the average diameters at NP (dNP) and rated burst pressure (dRBP) are typically measured at the corresponding NP and rated burst pressure (RBP):
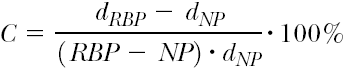
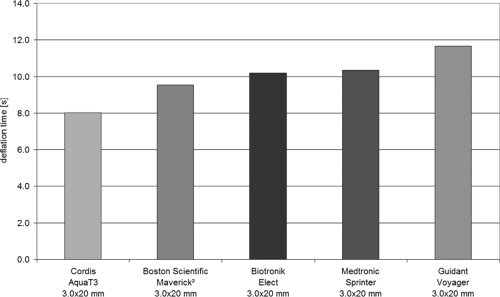 FIGURE 5-7. Average deflation time of PTCA balloon catheters (saline and contrast liquid Accupaque 300, Amersham Buchler, 50:50). PTCA, percutaneous transluminal coronary angioplasty. |
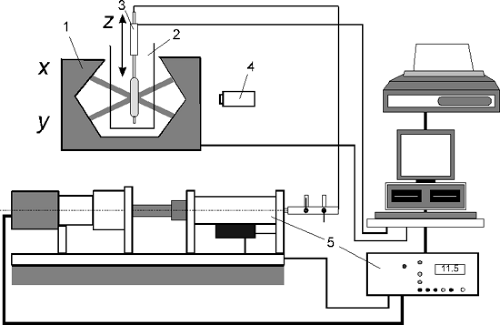 FIGURE 5-8. Measurement setup for balloon compliance (1, laser scanner; 2, water basin; 3, linear actuator; 4, camera; 5, pressure controller). |
Table 5-2 demonstrates that three balloons have a similar compliance, whereas the compliance of the two other balloons (Elect, Biotronik, and Aqua T3, Cordis) is much smaller; this can be seen in Figure 5-9, where the slope of the diameter versus the pressure curve indicates balloon compliance.
Balloon Burst Strength
High-pressure dilatation balloons are exposed to high stresses. The radial and axial stresses (σrad, σax) in the balloon material depend on balloon pressure p, balloon diameter d, and the thickness s of the balloon wall, assuming a simple cylindrical shape. Gross estimation provides20:
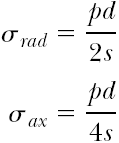
The balloon will burst if the stresses exceed the rupture stress of the material. It can be seen that under ideal conditions there is a linear correlation between stress, balloon pressure, and balloon diameter, and an inverse relationship to the balloon thickness. This means that, given the same material, a larger balloon diameter and thin balloon material will result in a lower burst pressure. In addition, the equations show that within the balloon the axial stress is half as big as the radial stress.
The burst strength is measured using a pressure controller, which is preferably computer controlled. The balloon must be stored in temperate water, and the regime of pressurization must be exactly defined. Usually the pressure is increased in steps of 1 bar until the balloon ruptures (burst pressure). This burst pressure is taken as the measure of the burst strength of the balloon.
The RBP indicated by the manufacturer represents the maximum recommended pressure for safe use of the balloon, and it is calculated from a statistically sufficient number of tests, ensuring that 99.9% of the tested balloons will not fail at RBP with 95% confidence.21 There is typically only a small pressure difference between RBP (recommended maximum pressure) and balloon rupture (failure), indicating a low margin of safety beyond RBP.
The RBP indicated by the manufacturer represents the maximum recommended pressure for safe use of the balloon, and it is calculated from a statistically sufficient number of tests, ensuring that 99.9% of the tested balloons will not fail at RBP with 95% confidence.21 There is typically only a small pressure difference between RBP (recommended maximum pressure) and balloon rupture (failure), indicating a low margin of safety beyond RBP.
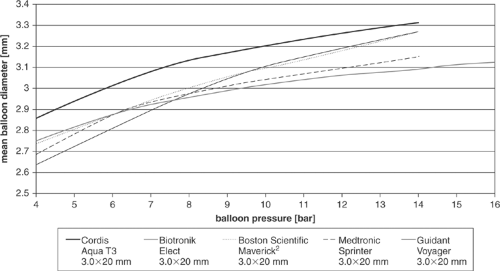 FIGURE 5-9. Measured compliance curves of five different PTCA balloon catheters. All the balloons were 3.0 mm in nominal diameter. PTCA, percutaneous transluminal coronary angioplasty. |
TABLE 5-2. Diameter Compliance of Different High-pressure PTCA Balloons | ||||||||||||||
|---|---|---|---|---|---|---|---|---|---|---|---|---|---|---|
| ||||||||||||||
Bending Stiffness
Bending stiffness is an important physical parameter of many interventional devices. When the bending stiffness is low, passage through curved pathways is expected to be easy and nontraumatic, but sufficient axial stiffness is required for the operator to be able to transmit the forces and control catheter movement. Low bending stiffness means high flexibility.
The flexibility of catheters and stents are measured using the setup shown in the Figure 5-10. The test object is fixed by a grip. The free bending length is fixed at 12 mm for practical reasons. The bending deformation d is applied automatically using the linear actuator. The resulting force F is measured by the load cell, which is contacted by a special device. The load cell has a measurement range of 0 to 100 mN at an accuracy of ±0.5% FS.
The displacement and force information is recorded using a computer, connected via a serial interface. The force-distance curve describes the spring modulus of the test object for bending. The bending stiffness (EI) is calculated taking the mean value of F/d, indicated by linear regression of the entire force-distance curve using the equation
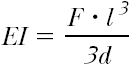 based on the theory describing the mechanics of a bent beam (F, bending force; l, bending length; d, bending deflection).22
Taking into account possible asymmetric structural properties of the test samples, the bending stiffness is measured in five different directions around the circumference and averaged. Typical results are discussed later, together with measurements of stent delivery systems with and without crimped stents.
Trackability, Crossability, and Pushability
The term trackability takes its origin from within the border zone between medicine and engineering. It describes the ability of a system to be advanced to a target lesion affected by several technical parameters such as friction, bending stiffness, and other factors.
The measurement of a vascular system’s tracking ability is designed to assess the ability of a stent/balloon system to pass
from a guiding catheter along a predetermined curved path. The results allow objective comparisons between different devices for each predetermined path. Long experience in measuring trackability shows experimental and clinical data to be highly comparable.
from a guiding catheter along a predetermined curved path. The results allow objective comparisons between different devices for each predetermined path. Long experience in measuring trackability shows experimental and clinical data to be highly comparable.
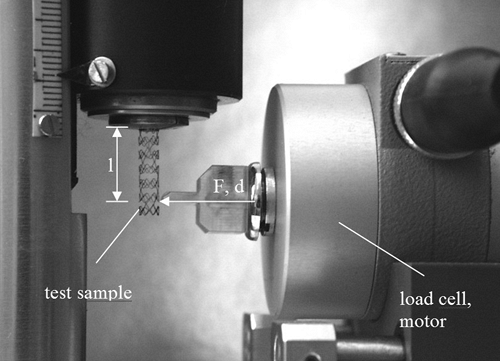 FIGURE 5-10. Test setup for the measurement of the flexibility of a cylindrical device (shown on behalf of an expanded coronary stent). |
The measurements can be performed using a two-channel push device (Fig. 5-11), which allows measurements of proximal and distal forces during the passage of the stent system through the guiding catheter and the vessel model. The test path is adapted to the anatomy of coronary vessels (Fig. 5-12), iliac bifurcation, or renal artery. A guiding catheter and a guidewire complete the simulated test environment. The test path is placed in a water bath at 37°C, to simulate the physiologic conditions important for the mechanical properties of hydrophilic or hydrophobic coatings of the catheters, associated with low-friction gliding, and for the mechanics of polymer devices.
For each dilatation or stent delivery system pushed through the test path, the tracking forces required along the path are measured, and the force-distance curves are recorded. Typical tracking curves are presented in Figure 5-13. From the tracking curves, it is clear that for all dilatation balloon catheters, the required track force increases with the length of the path. This behavior is immanent in the system because friction forces accumulate, and the larger the upfront loading force (indicated by the severity and rigidity of the obstruction at the catheter tip), the greater the pushing force required and the greater the tendency of the tip of balloon catheter to bend. However, the required pushing forces are decreasing as the design of modern balloon and catheter technology improves. Most balloon catheters and stent delivery systems currently used are coated with thin polymer layers to reduce the friction coefficient between the guiding catheter and the dilatation balloon, and between the dilatation balloon and the surrounding endovascular environment. The importance of coating can be measured using track tests and appears significant; yet, systematic comparison tests are difficult to perform because information on the nature of the coating is rarely available.
The crossability of a catheter describes its ability to pass stenoses. It is measured as a reactive head force distal to the stenosis. To test crossability, a setup can be used that simulates a vessel path with a stenosis at its end (Fig. 5-14). In this model, the lesion is characterized by an eccentric conical narrowing of the lumen, ranging from 2.5 to 1.2 mm. The model is attached to a load cell to measure the distal reactive force Fdist, which is taken as the measure of crossability. The proximal push force Fprox, applied by the operator to pass the lesion, is measured in parallel. It can be used to separate friction and bending effects along the whole catheter. The test arrangement of the vessel model with the simulated lesion is shown in Figure 5-14. For the crossability tests, the proximal traverse path of the drive is 60 mm long, starting from the end of the vessel model (point A in the figure). Distal displacement is not measured directly, but is assumed to be a little lower than the proximal traverse path due to catheter bending.
It can be expected that a low (distal) crossing profile, defined as the largest diameter of the folded balloon, will correspond to a low cross force, resulting in high crossability. Although there is no generally accepted definition, it has been suggested that the average distal reaction force Fdist should be used as the measure of crossability of the catheter (the lower the force, the better the crossability). In addition to the crossing profile, crossability also depends on balloon folding and compression characteristics.
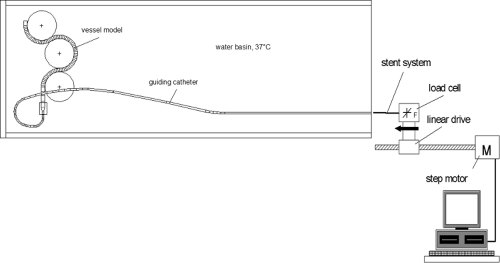 FIGURE 5-11. Schematic drawing of the two-channel push device with test arrangement for crossability investigations on coronary catheter/stent systems. |
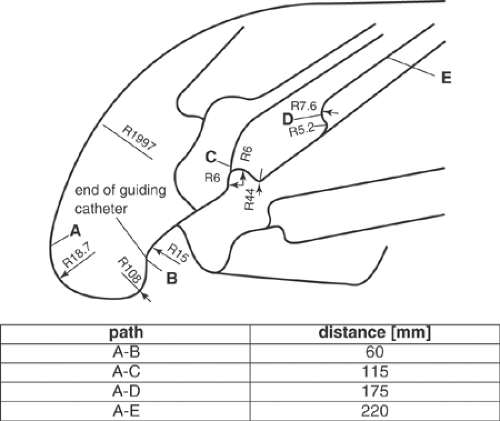 FIGURE 5-12. Tortuous path in the vessel model for trackability measurements of coronary systems. |
Pushability characterizes the load transfer from the proximal (interventionist’s) end to the distal tip of the catheter. High load transfer allows finer and more direct tactile control of the instrumentation. Even small obstructions that cause only a minor increase in reaction forces at the catheter tip can be felt by the operator, allowing him to tune and finely adjust the pushing force to overcome the obstacle while utilizing the least injurious maneuver. At the same time, high load transfer, if it is too high, may exceed the tactile abilities of the operator to precisely control and adjust the forces exactly to match the encountered resistance, leading to the transfer of potentially injurious forces to the catheter tip. Pushability is given in percent by:
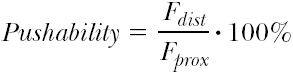 where Fdist and Fprox stand for the maximal measured distal and proximal forces.
The test setup developed to measure pushability is shown in Figure 5-15. It consists of a thrust piece (simulating a total occlusion) with a load cell at its distal end. To measure the distal reaction force, the proximal push force is measured with the second force channel. The push test is stopped in a force-controlled manner when the proximal force exceeds a specified maximum force to avoid catheter damage (e.g., 4.0 N). Before each test, the distal end of the stent delivery system is placed immediately in front of the simulated occlusion (starting point). The results given in Figure 5-16


Stay updated, free articles. Join our Telegram channel
Full access? Get Clinical Tree
