Pacing experiments in healthy animal hearts have suggested a larger detrimental effect of septal compared to free wall preexcitation. We investigated the intrinsic relation among the site of electrical preexcitation, mechanical dyssynchrony, and dysfunction in human patients. In 33 patients with Wolff-Parkinson-White (WPW) syndrome and 18 controls, regional myocardial deformation was assessed by speckle tracking mapping (ST-Map) to assess the preexcitation site, shortening sequences and dyssynchrony, and the extent of local and global ejecting shortening. The ST-Map data in patients with accessory atrioventricular pathways correctly diagnosed as located in the interventricular septum (IVS) (n = 11) or left ventricular free wall (LFW) (n = 12) were compared to the corresponding control values. A local ejecting shortening of <2 SD of the control values identified hypokinetic segments. The localization of the atrioventricular pathways by ST-Map matched with the invasive electrophysiology findings in 23 of 33 patients and was one segment different in 5 of 33 patients. In both WPW-IVS and WPW-LFW, local ejecting shortening was impaired at the preexcitation site (p <0.01). However, at similar electrical and mechanical dyssynchrony, WPW-IVS had more extensive hypokinesia than did WPW-LFW (3.6 ± 0.9 vs 1.8 ± 1.3 segments, p <0.01). Compared to controls, the left ventricular function was significantly reduced only in WPW-IVS (global ejecting shortening 17 ± 2% vs 19 ± 2%, p = 0.01; ejection fraction 55 ± 5% vs 59 ± 3%, p = 0.02). In conclusion, preexcitation is associated with local hypokinesia, which at comparable preexcitation is more extensive in WPW-IVS than in WPW-LFW and could adversely affect ventricular function. ST-Map might have a future role in detecting and guiding treatment of septal pathways with significant mechanical effects.
Pacing experiments in healthy animal hearts have indicated that septal, rather than free wall, electrical preexcitation is a source of mechanical dyssynchrony and dysfunction. Whether, in patients with Wolff-Parkinson-White (WPW) syndrome, a naturally occurring condition of preexcitation through an accessory atrioventricular pathway (AVP), the functional consequences also depend on the severity and site of the preexcitation, remains uninvestigated. The purpose of the present study was to investigate the characteristic patterns and the functional consequences of preexcitation-induced mechanical dyssynchrony in general and, more specifically, to compare the local and global functional effects of preexcitation of the interventricular septum (IVS) to that of the left ventricular free wall (LFW). To ensure capturing the early mechanical events associated with preexcitation (ie, those occurring even before QRS triggering), we exploited the ability of a recently developed speckle tracking mapping (ST-Map) technique to assess the timing and extent of regional myocardial shortening throughout the entire cardiac cycle, allowing us to noninvasively estimate the localization of the AVP and simultaneously estimate its effect on local and global ventricular function.
Methods
From December 2006 to June 2008, 36 adult patients with WPW syndrome who were scheduled for radiofrequency catheter ablation were prospectively enrolled in the present study. All patients underwent standard 12-lead surface electrocardiography within 24 hours before and after radiofrequency ablation to quantify the electrical preexcitation by the δ-wave duration (preexcited minus postablation QRS duration, in milliseconds). The electrophysiologic studies were guided using biplane fluoroscopy and a nonfluoroscopic catheter localization system (Localisa, Medtronic, Minneapolis, Minnesota). After the exclusion of patients with multiple AVPs (n = 2) and intermittent preexcitation (n = 1), the final patient group included 33 patients with WPW syndrome (10 women, age 34 ± 12 years). All subjects were in sinus rhythm and none had a cumulative arrhythmia burden >5 h/mo. The control group consisted of 18 matched healthy volunteers (8 women, age 39 ± 12 years) with normal electrocardiographic findings at rest, no abnormal cardiovascular history, and taking no cardiovascular medication. All subjects provided written informed consent before inclusion. The execution of the study conformed to the principles outlined in the Declaration of Helsinki for research of human subjects. The local institutional review board approved the study.
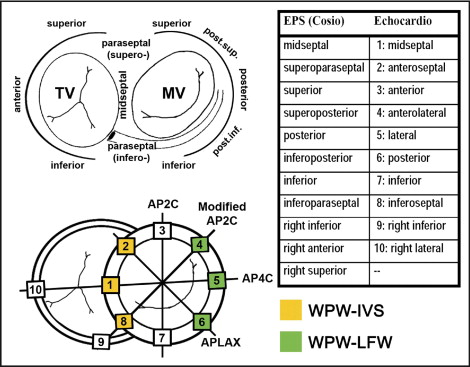
Echocardiography was performed by 2 examiners unaware of the clinical details within 24 hours before the electrophysiologic study in all but 5 patients, in whom it was performed 118 ± 70 days before. The patients and controls were examined in their at rest, unprovoked state using a Vivid 7 system (GE Vingmed Ultrasound, Waukesha, Wisconsin) according to a protocol previously described in detail. A minimum of 3 beats were acquired at end-expiratory apnea and exported to a computer workstation for off-line analysis. The left ventricular (LV) ejection fraction was calculated using the biplane Simpson method. Cardiac event timing was derived from the Doppler flow patterns over the left-sided valves. For ST-Map, additional single wall acquisitions (sector width <45°) were performed from the standard apical long-axis, 2-, and 4-chamber views, and an additional intermediate plane (modified 2-chamber view) crossing the inferoseptal and right inferior wall near the junction of the right and left ventricle ( Figure 1 ). This approach ensured optimal image resolution at greater frame rates (94 ± 11 Hz). A single examiner, unaware of the medical history and electrocardiographic and electrophysiologic results, extracted and processed all deformation data off-line. Longitudinal deformation curves were extracted using commercially available speckle tracking software (Echopac, version 6.0.2, GE Healthcare, Horten, Norway), as previously described in detail. Spatial smoothing was set at 1/2 of the default value to increase the spatial resolution; 6 evenly distributed samples were placed from the base to apex in each wall. The zero reference point of deformation (by default the QRS trigger) was adjusted to QRS onset. The timing of the onset of shortening was measured in all sampled LV and right ventricular regions. The basal segment with the earliest shortening and in which the onset of shortening was seen to propagate toward the apex was regarded as the AVP insertion site. The entire pattern of onset times throughout the ventricular base was taken into account to optimize the localization process ( Figure 2 ). To allow a comparison between the electrophysiologic (reference) and echocardiographic results, a system matching the Cosio et al and echocardiographic nomenclature and segmentation was agreed on before the study ( Figure 1 ). Agreement between modalities was scored in ranked order, with 1 indicating correct, 2, adjacent segment, and 3, incorrect.
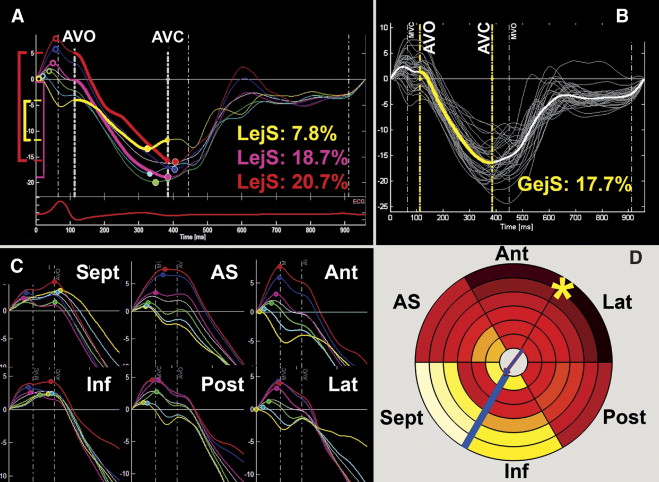
Subsequently, a detailed ST-Map of the spatiotemporal dyssynchrony characteristics and the local shortening patterns was performed in the controls and patients diagnosed as WPW-IVS (n = 11) or WPW-LFW (n = 12) by both modalities (agreement score 1 and 2). The baseline characteristics of these study groups are listed in Table 1 . All deformation data from the septal, anteroseptal, anterior, lateral, posterior, and inferior walls (36-region model) of these groups was additionally postprocessed using a dedicated 3-dimensional reconstruction software program. The standard deviation (SD) of the regional onset and peak times was derived to quantify intra-LV dyssynchrony. To quantify how much this dyssynchrony was spatially organized (instead of randomly dispersed) and to express the shortening sequences, shortening vectors in the axial (apex–base) and transverse plane were calculated. The magnitude of these vectors indicates the overall time difference between the opposing sides within the left ventricle, their direction points from the earliest to the latest side. Finally, local ejecting shortening (LejS), a measure of local external work, was measured as the difference between the shortening value at aortic valve opening and closure. Averaging all 36 regional LejS values yielded the global ejecting shortening value, expressing the effective LV shortening during ejection ( Figure 2 ). The standard 16-segment LV model was used to quantify and report the segmental LejS values, and the 36-region color-coded models provided details on the spatial patterns of local shortening. Each segment with a LejS <2 SD which is the lower limit of the corresponding segment in healthy controls was scored as “hypokinetic.” The absolute difference with this lower LejS limit in each hypokinetic segment was summed to estimate the “total burden of hypokinesia” in analogy to the 16-segment wall motion score.
| Variable | WPW-IVS (n = 11) | WPW-LFW (n = 12) | Healthy Controls (n = 18) |
|---|---|---|---|
| Age (years) | 32 ± 14 | 34 ± 13 ⁎ | 39 ± 12 |
| Women | 4 (36%) | 3 (25%) ⁎ | 8 (44%) |
| Heart rate (beats/min) | 63 ± 14 | 61 ± 8 ⁎ | 61 ± 11 |
| Systolic blood pressure (mm Hg) | 122 ± 14 | 128 ± 16 ⁎ | 123 ± 16 |
| Diastolic blood pressure (mm Hg) | 74 ± 13 | 80 ± 10 ⁎ | 75 ± 13 |
| Length (cm) | 176 ± 11 | 183 ± 7 ⁎ | 176 ± 12 |
| Weight (kg) | 76 ± 12 | 81 ± 13 ⁎ | 69 ± 13 |
| Left ventricular end-diastolic diameter (mm) | 51 ± 7 | 51 ± 3 ⁎ | 50 ± 3 |
| Left ventricular end-systolic diameter (mm) | 38 ± 5 | 38 ± 3 ⁎ | 35 ± 4 |
| PQ duration (ms) | 102 ± 22 | 115 ± 16 ⁎ | 163 ± 17 † |
| QRS duration (ms) | 130 ± 14 | 124 ± 15 ⁎ | 98 ± 10 † |
| δ-Wave duration (ms) | 35 ± 13 | 29 ± 15 ⁎ | NA |
| Arrhythmia burden (hours/month) | 1.2 ± 1.7 | 1.0 ± 1.1 ⁎ | NA |
⁎ Not significantly different from WPW-IVS, all p ≥0.10 by analysis of variance.
Statistical analysis was performed using the Statistical Package for Social Sciences, version 15.0 (SPSS, Chicago, Illinois). p Values <0.05 were considered statistically significant. Within-group results are presented as the mean ± SD and percentages. Categorical data were compared using Fisher’s exact test. Differences in continuous data between patient groups were compared using one-way analysis of variance with Hochberg’s GT2 post hoc correction for multiple comparisons when the assumption of homogeneity of variances could be confirmed and using Brown-Forsythe testing and Dunnett’s T3 post hoc analysis in cases in which this assumption was not met. The bivariate correlation for ranked variables was performed using Spearman’s rank correlation analysis.
Results
Overall, the accuracy of noninvasive AVP localization using ST-Map depended on the QRS duration (r = 0.438, p = 0.011) and δ-wave duration (r = 0.373, p = 0.033) but not on the PQ duration. In 23 (70%) of 33 patients, segmental localization matched between ST-Map and the electrophysiologic study (score 1). In 5 (15%) of 33 patients, ST-Map located the AVP in the adjacent segment (score 2), while in the remaining 5 (15%) patients, ST-Map mislocated the AVP (score 3). All AVPs located within the IVS were categorized as such by ST-Map (see Supplemental Table for details ).
Of a total of 1,476 LV segments, the tracking quality was deemed sufficient to be included in the analyses for 1,425 (97%). Acquisition success was similar for all groups. The anterior wall had the lowest feasibility (91%) and the septum, the greatest (99%). The temporal resolution averaged 10.8 ± 1.3 ms. No differences were found among the 3 study groups when dyssynchrony was expressed by the SD of either onset or peak shortening. Vector analysis, however, revealed markedly different shortening sequences. In the normal left ventricle, the onset of shortening was characterized by a marked, positive axial vector (apex-to-base sequence) and a smaller transverse component (visible as a gradient from dark to light from inside to outside and, to some extent, from left to right in the bullseye plot; Figure 3 ). Both patient groups had an inversed axial vector (base-to-apex sequence) and a larger transverse vector, pointing away from the preexcited basal region ( Figure 3 and Table 2 ). The transverse component was significantly larger than that in controls only in patients with WPW-IVS. Similar differences between the 2 WPW groups and controls were observed when sequences of peak shortening were analyzed. None of the mechanical dyssynchrony parameters differed significantly between both WPW groups.
| Subjects | Mechanical Activation (Onset Times) (ms) | Peak Shortening Times (ms) | ||||
|---|---|---|---|---|---|---|
| SD | Apex–Base Vector | Transverse Vector | SD | Apex–Base Vector | Transverse Vector | |
| WPW-IVS | 34 ± 6 | −5 ± 21 ⁎ | 49 ± 16 † | 45 ± 18 | −43 ± 42 † | 65 ± 32 † |
| WPW-LFW | 34 ± 13 | −14 ± 22 ⁎ | 51 ± 32 | 41 ± 11 | −59 ± 39 ⁎ | 45 ± 29 |
| Control | 41 ± 10 | 45 ± 32 | 33 ± 15 | 33 ± 7 | −9 ± 26 | 30 ± 18 |
Table 3 lists the segmental LejS values in both WPW groups and the control group. The bullseye plots in Figure 4 display in more detail where and how much the regional LejS values in the WPW-IVS and WPW-LFW groups deviated from the reference values in the control group. In both groups, reduced LejS was found in the proximity of the suspected AVP, with a spatial pattern corresponding well to the pattern of earliest onset and, in particular, of peak shortening ( Figure 3 ). In neither of the 2 WPW groups, was the impaired LejS in the preexcited regions sufficiently compensated for by augmented LejS in remote regions, resulting in an overall shortening deficit on the LV level, in particular in the patients with WPW-IVS. As can be further deduced from the bullseye plots, the patients with WPW-IVS had more severely reduced LejS than did the patients with WPW-LFW, in terms of both spatial extent and severity (represented by the increased number and intensity of blue regions, respectively). Thus, the amount of hypokinetic segments (3.6 ± 0.9 vs 1.8 ± 1.3, p <0.01) and the total burden of hypokinesia (18.5 ± 10.1% vs 4.5 ± 4.4%, p <0.01) was larger in those with WPW-IVS than in those with WPW-LFW. This was true at every level of electrical preexcitation (δ-wave duration), indicating an independent effect of AVP localization on the amount of hypokinesia ( Figure 5 ). Moreover, although in those with WPW-LFW, a correlation was observed between the δ-wave duration and burden of hypokinesia, such a relation was absent in those with WPW-IVS. As a result, global ejecting shortening (17 ± 2% vs 19 ± 2%; p = 0.01) and the LV ejection fraction (55 ± 5% vs 59 ± 3%; p=0.02) were significantly lower in those with WPW-IVS than in the control group. Patients with WPW-LFW had intermediate values for LV ejection fraction (57 ± 3%) and global ejecting shortening (18 ± 1%), that did not differ significantly from either other group. In 6 of 11 patients with WPW-IVS and 3 of 12 patients with WPW-LFW, the LV ejection fraction was <55%, with 2 of the former patients presenting with a LV ejection fraction of ≤50%.
Stay updated, free articles. Join our Telegram channel

Full access? Get Clinical Tree


