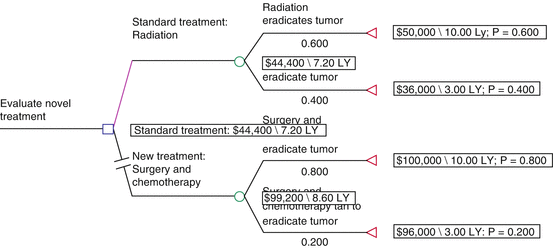
Fig. 3.1
A generic decision tree for cost-effectiveness analysis for treatment of cancer

Fig. 3.2
Rolled back decision tree depicting the overall costs and the utilities associated with either treatment option

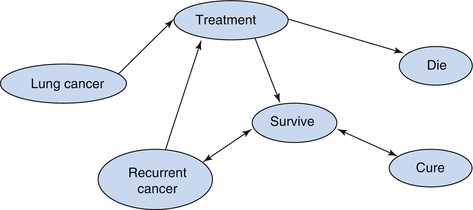
Fig. 3.3
A simple Markov model depicting the transition from one state of health to another
Special Situations
Cost-Effectiveness Analysis (CEA)
CEA refers to a unique situation in decision analysis whereby the objective is to maximize population health benefits for any given level of resources. The same approach may be used given a preset health benefit goal, with the objective of minimizing the cost of attaining it. Such an analysis is often performed from a payer’s perspective. In this perspective the costs of therapy are those experienced by the payer of treatment. Alternate approaches are to consider the societal perspective or a combined approach. In a combined perspective analysis, the costs of treatment are those experienced by the payer, minus the monetary gains to society from an individual who lives longer due to a more effective treatment. The costs of therapy may include direct medical costs, non healthcare costs (transportation, dietary changes, exercise programs etc.), caregiver time costs, loss of productivity, and costs of future healthcare interventions with longevity gained by treatment. Effectiveness of therapy is typically measured in QALYs. In a typical CEA, the incremental cost-effectiveness ratio (ICER) is estimated as the cost per life year (or quality-adjusted life year) gained over the patient’s remaining lifetime by using a decision model and is a measure of cost-effectiveness. If one treatment modality is less costly and more effective than the other, it is labeled as dominant.
Markov Modeling
Thus far we have considered a linear model in the decision tree where a cohort moves forward in time. A state-transition model, also called a Markov model, is also commonly utilized in decision analyses. Markov models allow patients or groups of patients to transition from one state of health/disease to another as they move through the model. The specific strength of Markov models is this ability to reflect disease progression over time by using different health states or events. Therefore, these models are usually well understood by clinicians and can make direct use of traditional epidemiological survival data (e.g. annual rates, Kaplan-Maier curves, time-to-event distributions). A Markov model can be used to simulate both short-term processes (e.g. recovery after an operation), and long-term processes (e.g. an individual’s life span).
Markov models can be analyzed in several ways. One of the most common is known as cohort simulation. A cohort of patients begins the model in any of the disease states and the cohort is then tracked for the duration of the model. The proportion of the cohort in any of the states at any point in time, and the mean duration in each state can be calculated. Alternatively, the Monte Carlo simulation (microsimulation) approach operates at the level of the individual patient. Many hypothetical patients are passed individually through the model and their disease pathways recorded, replicating as closely as possible the process of interest. This allows investigators to simulate variability in outcome on both the individual and population level.
Other Clinical Applications of Decision Analysis
Healthcare Policy
Decision analysis techniques are implicitly and explicitly employed in the development of health policy. These applications range from recommendations from national and international working groups about management of specific disease processes, to cost-effectiveness analyses that inform whether or not certain treatment options are viable.
Clinical Protocols
Clinical protocols can be developed using the “PROACTIVE” approach and by eliminating the nonoptimal alternatives in a decision tree. This approach is relatively rigid and is most suitable when patient preference is less likely to alter the decision.
Stay updated, free articles. Join our Telegram channel

Full access? Get Clinical Tree


