CT Imaging of Coronary Artery Calcification
William Stanford
INTRODUCTION
Cardiovascular disease (CVD) affects millions of individuals annually and is the leading cause of death in the United States. In 2007 the American Heart Association (AHA) estimated there were 82,600,000 Americans who were suffering from some form of CVD and that 813,804 had died; the economic loss was estimated at $286.6 billion (1). Of those affected 16,300,000 were victims of angina and heart attacks, and importantly 18% of these heart attack victims were under age 65. Thus coronary artery disease (CAD) has a major impact on our economy and workforce.
Impacting these figures is the fact that CAD often remains silent until a major catastrophic event occurs. This is exemplified by the fact that of the 286,000 individuals dying from CAD in 2007, only 50% of men and 36% of women had had previous symptoms. Because of this it becomes increasingly important to try to identify the individuals at risk before a major cardiovascular event occurs. Although epidemiologic studies have identified numerous cardiac risk factors, traditional risk factors only predict approximately two-thirds of the patients who will eventually succumb to heart disease (2). In fact, approximately one-third of individuals dying annually of heart disease have no identifiable Framingham risk factors that would predict a future “hard” cardiac event (3). Because of this considerable interest is occurring in developing screening methodologies that can both quantitatively measure the severity of CAD and accurately predict future risk. Coronary artery calcification (CAC) has long been known to correlate with CAD severity and multidetector computed tomography (MDCT) imaging has proven extremely sensitive in its detection. Since calcification is a manifestation of the atherosclerotic disease process, MDCT imaging has evolved as a major screening modality for individuals at risk for a coronary event. The fact that calcification occurs early in the atherosclerotic process and that
MDCT screening of coronary calcification can often identify an “at-risk population” and can do this early in the disease process when the plaque begins to build within the wall of the vessel and before the disease has advanced to cause vessel stenoses or occlusion has been an important factor in the development of imaging methodologies. Of these methodologies, CAC imaging has emerged as a prognostic indicator of increased risk and numerous investigators have promoted MDCT imaging of coronary calcium as an accurate, costeffective screening methodology for evaluating coronary heart disease (CHD).
MDCT screening of coronary calcification can often identify an “at-risk population” and can do this early in the disease process when the plaque begins to build within the wall of the vessel and before the disease has advanced to cause vessel stenoses or occlusion has been an important factor in the development of imaging methodologies. Of these methodologies, CAC imaging has emerged as a prognostic indicator of increased risk and numerous investigators have promoted MDCT imaging of coronary calcium as an accurate, costeffective screening methodology for evaluating coronary heart disease (CHD).
The indications for MDCT imaging of CAC have begun to standardize over the past few years. Current applications have centered around: (1) The identification of individuals at risk for CAD, especially if their Agatston calcium score is >400; (2) additional stratification of individuals at intermediate risk per other stratification protocols such as the Framingham Risk Score; (3) identification of individuals with extensive CAC where additional imaging such as computed tomographic angiography (CTA) may be compromised because of masking by the calcification; and (4) ruling out a cardiac etiology in patients presenting to emergency rooms (ERs) with chest pain and normal cardiac enzymes and electrocardiograms (EKGs). In this chapter we explore the use of coronary calcium imaging with emphasis on the above applications.
ATHEROSCLEROTIC PLAQUE DEVELOPMENT
Coronary arteriosclerosis is a complex and unpredictable process thought to be related to biochemical, genetic, and environmental factors. Since traditional risk factors, such as smoking, age, gender, obesity, hypertension, hyperlipidemia, and diabetes mellitus are thought to be linked to overall risk, these assessments are important; however, they do a relatively poor job in predicting individual risk for CHD. Regardless of the presence or absence of specific risk factors, the development of arteriosclerosis remains an inevitable part of aging.
Atherosclerosis begins early in life. The earliest atherosclerotic lesion (type I plaque) is characterized by the accumulation of lipid-laden macrophages (foam cells) within the intima of arterial walls. With further accumulations of intra- and extracellular lipids, type II (fatty streak) and type III (pre-atheroma) lesions develop. These may be grossly visible and often contain small foci of calcium on histologic examination. Although these lesions are hemodynamically innocuous and potentially reversible, they represent lesions that can progress to the more clinically important type IV and V lesions (4).
Both type IV and type V lesions (atheroma) are well-developed plaques characterized by intramural collections of both cholesterol and phospholipids. These deposits are frequently covered by a thin, fibrous cap (fibroatheroma) and often coexist without associated significant luminal narrowing (Fig. 24.1). Therefore, the extent of the disease is often underestimated and undetected by conventional angiography. In fact, up to two-thirds of patients with acute myocardial infarctions (MIs) or unstable angina often have only minimal angiographic narrowing at the site of plaque deposition (5). Because of this myocardial perfusion and stress echocardiography studies which rely on effects of occlusion are often normal and thus traditional screening and risk-factor assessments commonly underestimate an individual’s risk for sudden cardiac death.
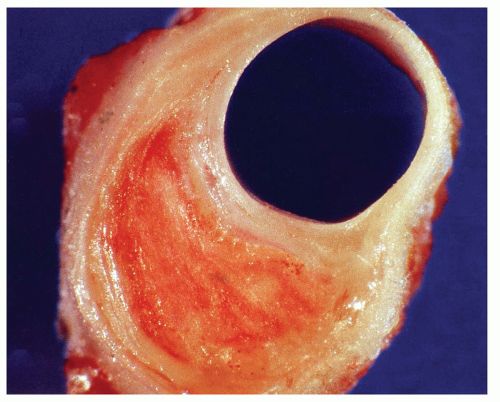 Figure 24.1. Non-occlusive atherosclerotic plaque in the wall of a coronary artery. The patient is at risk even though there is no luminal stenosis present. (Reprinted from: Davies MJ. Atlas of Coronary Artery Disease. Philadelphia, PA: Lippincott-Raven; 1998, Figure 2-29, with permission.) |
Unfortunately, these plaques are predisposed to spontaneous rupture and thus type IV and V lesions are often referred to as “vulnerable plaques.” As such, vulnerable plaques are responsible for much of the morbidity and mortality from CAD. Why plaques rupture is unclear, but the process is likely multifactorial and related to biomechanical stresses and localized plaque inflammation.
Once a fibrous cap ruptures, the lipid core in the wall of the artery is exposed to flowing blood and an acute thrombogenic reaction frequently ensues. Repeated thrombosis and subsequent recanalization may result in partial narrowing or complete occlusion, and if so, the narrowing is often manifested clinically by episodes of ischemia and/or infarction. If a severe stenosis is present at the site of plaque rupture, total vascular occlusion is often likely, and this may account for many of the cardiac deaths seen annually.
With repeated plaque rupture, type IV and V plaques become transformed into type VI lesions, which are considered histologically “complicated” plaques that are characterized by fibromuscular tissue deposition occurring from plaque repair and healing. With repeated injury and healing, type VI lesions often grow in size to eventually produce significant arterial narrowing. Thus, type VI lesions have a greater occurrence in patients with chronic and/or stable angina, and because they produce narrowing, they are commonly detected by traditional imaging techniques that screen for the hemodynamic effects of stenoses (6).
HISTORICAL ASPECTS IN THE IMAGING OF CORONARY CALCIFICATION
The association of calcium with coronary atherosclerosis dates back to before 1959 (7). Early studies using fluoroscopy showed that it was possible to identify calcific coronary plaques, but it was not until the development of the Electron Beam CT scanner in the early 1980s that the identification of calcium became important in risk management protocols.
In 1983 Dr. Douglas Boyd, a researcher at University of California, San Francisco, developed the Electron-beam CT scanner (8). The unique design of this Electron-beam Computed Tomography (EBCT) scanner had many advantages in coronary artery imaging. Its excellent temporal resolution produced images of the heart in near real time and did so with excellent spatial resolution. This technology reduced acquisition times to 50 to 100 milliseconds which, when coupled with its spatial resolution, initially made EBCT the new gold standard in CAC detection and quantification.
With an EBCT 50- to 100-millisecond study the entire coronary circulation could be scanned within a 20- to 30-second breath-hold. An additional advantage was that the effective radiation dose was only approximately 0.7 mSv (9).
These scanners have now given way to newer-generation MDCT scanners. The introduction of multidetector-row scanners (4, 8, 16, 32, 64, and now 256 and 320 dual source scanners) have improved z-axis coverage per revolution and thus have decreased temporal resolutions to ±75 milliseconds (10).
MULTIDETECTOR CT SCANNERS
MDCT scanners have detectors capable of generating up to 320 slice images with each gantry rotation, and gantry rotation times have decreased from 1,000 to 280 milliseconds, and with segmented reconstruction and dual source technologies, temporal resolutions of 75 milliseconds are now possible. An added advantage of MDCT imaging is that the information generated can occur as a volumetric data set and this permits reformations at various times in the cardiac cycle. MDCT images are commonly ECG gated, and this further decreases motion unsharpness by allowing image acquisition during the quieter phase of the cardiac contraction. The latter is particularly important in coronary calcification imaging.
Current multidetector CT scanners generate images by both prospective and retrospective gating. In prospective gating the scanner is activated only during the time needed to acquire the image. Data collection is initiated from the R-wave of the ECG and the operator can select the desired delay. This mode is frequently used in coronary artery calcium imaging because patient radiation dose can be kept to a minimum. However, rapid or irregular heartbeats can affect both image quality and reproducibility. Current scanners can be programmed to provide 0.5- to 0.6-mm slice thicknesses of the heart during one cardiac contraction and do so with scanning times as rapid as 75 milliseconds (10).
Retrospective gating is also a commonly used operating mode. In this sequence helical scanning of the entire heart occurs along with the simultaneous recording of the patients’ ECG. Upon completion of the scan, the images can be reconstructed at a preselected phase of the cardiac cycle. In order to avoid anatomical gaps in the data set, the pitch is set very low; thus patient radiation exposure is higher. Nevertheless, the ability to reconstruct images during multiple phases of the cardiac cycle and do so from the same high-resolution data set can provide important information. However, the patient’s heart rate can be a major factor influencing image quality, and if the heart rate exceeds 65 to 70 bpm, betablockers are commonly administered to allow data collection during a single heartbeat. These advances have led to an increased emphasis on CAC imaging.
IMPORTANCE OF IMAGING CORONARY CALCIUM
Strong correlations have been found between quantitative measurements of coronary artery calcium (CAC) and measurements of atherosclerotic plaque area and volume (11). Supporting these observations was an article by Mautner et al. (12) who examined 1,298 segments from 50 heart specimens and observed that 93% of arteries with stenoses greater than 75% had CAC. Conversely, only 14% of arteries with stenoses less than 25% were associated with calcium. However, in spite of these sensitivities calcium measurements derived from CT cannot predict site-specific stenoses as shown in articles by Bormann et al. (13) and Sangiorgi et al. (14). Therefore, CAC measurements cannot be used to predict site-specific locations nor the severity of the stenoses.
CALCIUM SCORE REPORTING
Several CAC software scoring packages which enable operators to quickly perform CAC quantitative measurements are commercially available (Fig. 24.2). In these packages, coronary calcification thresholds are generally set at two to three contiguous pixels at attenuations of+130 Hounsfield units. The +130 Hounsfield unit threshold was chosen because it is approximately two standard deviations higher than the attenuation of blood and has been found to correlate well with plaque calcium measurements (15).
Calcium scores are reported using the Agatston score (15), volume score, and mass score.
The Agatston score was the initial reporting score and is used in much of the older literature. It used EBCT technology to identify lesions located over the course of the coronary artery. In calculating the score, a region of interest is placed around each lesion and the area of the lesion is multiplied by a factor of 1 to 4 with 1 being a peak calcification of 130 to 199 HU, 2 being a peak calcification of 200 to 299 HU, 3 being a peak calcification of 300 to 399 HU, and 4 being a peak calcification of >400 HU.
The volume score reports the volume of the threshold calcifications.
The mass score uses a calibration factor derived from the simultaneous imaging of a phantom containing a known amount of calcium. The phantom is placed in the scanning field and a calibration factor determined. From it the calibration factor times
the volume of a voxel times the number of voxels containing the threshold calcification times the mean CT Hounsfield number for each lesion equates to the mass score. The total score is the sum of the individual scores.
the volume of a voxel times the number of voxels containing the threshold calcification times the mean CT Hounsfield number for each lesion equates to the mass score. The total score is the sum of the individual scores.
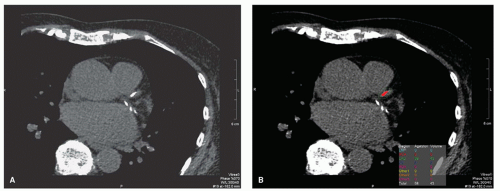 Figure 24.2. Sixty-four-slice multidetector CT image showing calcium deposits in the left anterior descending and circumflex coronary arteries (A). The calcifications show up as white areas in their respective arteries. B: Same subject as in (A). The scoring program identifies each calcification (red area in LAD) and prints out the Agatston, volume, and total scores. |
These values can then be compared to normalized population data bases, based on age- and gender-matched controls, and can be used in assessing both disease severity and for determining disease progression. The calcium volume score and calcium mass score are increasingly used in reporting calcium burden.
STANDARDIZATION OF CT SCANNERS
In order to assure calcium score reproducibility, it is important that CT scanner protocols be standardized so that scores from one scanner can be compared with another. Toward that end the Physics Task Group of the International Consortium on Standardization in Cardiac CT was formed (16). Using a phantom with inserts of calcium and water density material embedded in an epoxy anthropomorphic body torso, scanning algorithms for all five commercially available scanners were developed. The manufacturers were: Toshiba, Imatron, General Electric, Phillips, and Siemens. These scanners were calibrated against the phantom for temporal and spatial resolution and noise. To accommodate different patient sizes, circumferential rings were added. Using consortium-developed scanner algorithms variations of 4% for Agatston scores, 7.9% for volume scores, and 4.9% for mass scores could be achieved. The calculated calcium score was found to be within ±5 mgm of the actual calcium mass of the phantom (16).
REPRODUCIBILITY ISSUES
As mentioned, a major consideration in the utilization of calcium scores is the variability of calcification scores between serial CT scans on repeat imaging as well as between the various scanners. To assess for disease progression, CT measurements must be accurate and reproducible. To explore this issue, a number of studies have examined inter-scan variability between EBCT and helical scanners and between the various helical scanners. These studies report a small inter-scan variability between EBCT and MDCT of approximately 15%; inter-reader variability of approximately 3%; and intra-reader variability of less than 1% (17,18).
Factors primarily responsible for the increased inter-scan variability are slice misregistration resulting from cardiac and respiratory motion, noncontiguous acquisition of image data (image gaps), image noise, changes in scanner calibration, cardiac arrhythmias/ECG triggering problems, and patient motion.
The use of volumetric measurement (19) has helped reduce variability, as has the incorporation of a phantom as part of the calcium mass examination. The volumetric and calcium mass scores are increasingly being reported at many of the sites performing CAC screening.
Reproducibility was recently studied in Multi-Ethnic Study of Atherosclerosis (MESA) patients. Duplicate scan differences in the MESA study of 6,814 multiethnic individuals, scanned on three EBT and three MDCT scanners, were 20.1% for the Agatston score, and 18.3% for the volume score (p < 0.01) (20). Current reported variability on 16-to 64-slice MDCT scanners range from 8% to 18% for the Agatston, volume, and mass scores. Thus in assessing CAC progression, this variability must be taken into account before calcium progression can be assured.
RADIATION DOSAGE
The effective radiation dosage is a measure of the total radiation exposure to the patient. This is reported in millisieverts (mSv) and is frequently equated to months of background
radiation exposure. For an EBCT prospective calcium study, the effective dose approximates 1 mSv in males and 1.3 mSv in women (4 and 5.2 months of background radiation, respectively) (21).
radiation exposure. For an EBCT prospective calcium study, the effective dose approximates 1 mSv in males and 1.3 mSv in women (4 and 5.2 months of background radiation, respectively) (21).
For a MDCT prospectively triggered coronary calcification study, the effective dose approximates 1.5 mSv in males and 1.8 mSv in women (6 and 7.2 months of background radiation). However, newer MDCT scanners can deliver prospective coronary calcification scoring with radiation doses of <1 mSv (10). If the MDCT coronary calcium study were retrospectively gated, the radiation exposure would increase to approximately 3 mSv in males and 3.6 mSv in women which would equate to 12 and 14.4 months of background radiation. Recent developments in modulation techniques however can now ramp down the power during noncritical imaging times and this can decrease radiation exposure by up to 80% (22).
With all imaging radiation dose should be as low as possible and since individuals may have multiple CT scans over their lifetime, total radiation doses may be problematic as shown by Kim et al. (23) who estimated if men 45 to 75 years were to have a CAC scan every 5 years, the estimated cancer risk using a median dose of 2.3 mSv was 42 cases per 100,000 men and 62 cases per 100,000 women.
CORONARY ARTERY CALCIUM AS AN INDICATOR OF CORONARY ARTERY STENOSIS
For many years researchers have recognized an association between CAC and coronary artery stenosis, and a number of reports have shown that as EBCT calcium scores increase, the likelihood of having a significant stenosis (greater than 50% luminal narrowing) increases.
These studies were summarized by O’Rourke et al. (24) in a meta-analysis of 3,683 patients who underwent both EBCT and coronary angiography. They found the presence of CAC had a weighted sensitivity for detecting significant stenoses of 80%, a weighted specifically of 39%, and a predictive accuracy of 59%.
Because of wide variations in calcium score reporting, Rumberger et al. (25) attempted to optimize levels of calcium that equated with the best sensitivity and specificity. He suggested that a calcium score of 80 optimized specificity (85%) while still maintaining a reasonably good overall sensitivity of 84%. In addition, he found that calcium scores between 167 and 370 correlated with a 90% specificity for detecting stenosis with >50% narrowing, while calcium scores >370 were associated with a 90% specificity for at least one luminal stenosis of 70% or more (26).
The largest series reporting EBCT calcium as an indicator of stenosis was a multicenter study of 710 patients with symptomatic CAD. This study included 456 men and 254 women (mean age, 56 years) (27). The study reported a sensitivity of 95% for the detection of significant stenosis and a specificity of 44%. The positive predictive value was 72%, and the negative predictive value (NPV) was 84%.
Similar studies have been reported in the MDCT literature. A representative study was that of Venkatesh et al. (28). These investigators evaluated the presence of CAC in detecting >50% obstructive plaque as compared to CTA and conventional angiography in low-risk patients and found the following:
Ca Score 0 =3.1% obstructive plaque
Ca Score 1 − 200 = 15.1% obstructive plaque
Ca Score > 200 = 50% obstructive plaque
Their conclusions were that patients with low calcium scores had a low presence of obstructive plaque.
Stay updated, free articles. Join our Telegram channel

Full access? Get Clinical Tree


