Persistently high cardiac troponin T (cTnT) levels reflect myocardial damage in heart failure (HF). The presence and extent of myocardial fibrosis assessed by cardiac magnetic resonance (CMR) and high levels of cTnT predict poor prognosis in various cardiomyopathies. However, the association between myocardial fibrosis and transcardiac cTnT release has not been evaluated. This study investigated the correlation between myocardial fibrosis and transcardiac cTnT release from nonischemic failing myocardium. Serum cTnT levels were measured in aortic root (Ao) and coronary sinus (CS) using highly sensitive assay (detection limit >5 ng/L) in 74 nonischemic patients with HF who underwent CMR. Transcardiac cTnT release (ΔcTnT [CS-Ao]) represented the difference between CS and Ao-cTnT levels. Myocardial fibrosis was quantified by late gadolinium enhancement (LGE) volume and %LGE on CMR. cTnT was detectable in 65 patients (88%), and ΔcTnT (CS-Ao) levels were available (ΔcTnT [CS-Ao] >0 ng/L) in 60 patients (81%). LGE was observed in 42 patients (57%), and ΔcTnT (CS-Ao) levels were available in 41 LGE-positive patients (98%). In patients with available cTnT release, ΔcTnT (CS-Ao) levels were significantly higher in LGE-positive patients than those in LGE-negative patients (4.3 [2.2−5.5] vs 1.5 [0.9−2.6] ng/L; p = 0.001). Log (ΔcTnT [CS-Ao]) levels were correlated with LGE volume (r = 0.460, p = 0.003) and %LGE (r = 0.356, p = 0.03). In conclusion, the amount of transcardiac cTnT release was higher in LGE-positive patients than LGE-negative patients and correlated with the extent of LGE in nonischemic patients with HF. These results suggested that ongoing myocardial damage correlates with the presence and extent of myocardial fibrosis.
Persistent and modest elevation of circulating cardiac troponin is frequently observed and represents ongoing subclinical myocardial damage in patients with heart failure (HF) regardless of overt coronary artery disease. High levels of cardiac troponin predict poor prognosis in patients with HF and several nonischemic cardiomyopathies. Myocardial fibrosis is a common feature of wide variety of cardiomyopathies and is thought to contribute to cardiac dysfunction, ventricular tachyarrhythmia, sudden cardiac death, and progression of HF. Cardiac magnetic resonance (CMR) imaging with the late gadolinium enhancement (LGE) technique allows the detection of myocardial fibrosis. It has been reported that the presence and extent of CMR-LGE are a useful predictor of sudden cardiac death and adverse outcome in several nonischemic cardiomyopathies. It has been speculated that persistent troponinemia, representing ongoing subclinical myocardial damage, represents progressive myocardial fibrosis and contributes to the progression of HF. However, this concept has not been fully demonstrated in patients with HF in the clinical situation. In this study, we directly measured transcardiac cardiac troponin T (cTnT) release into the coronary circulation using the highly sensitive cTnT (hs-cTnT) assay and investigated the correlation between the presence and the extent of myocardial fibrosis assessed by CMR-LGE and transcardiac cTnT release in nonischemic patients with HF.
Methods
The study subjects were 74 consecutive patients with nonischemic HF who underwent both cardiac catheterization and contrast-enhanced CMR imaging between January 2007 and September 2013 at the Kumamoto University Hospital. The interval of the performance of cardiac catheterization and CMR was within 3 months, and the mean interval of the 2 procedures was 10 ± 12 days. Eligible patients were 20 years or older who met the criteria for the diagnosis of HF set by the American College of Cardiology/American Heart Association Stage B or C classification. All patients were clinically stable and under optimal medical therapy for HF, including stable doses of an angiotensin-converting enzyme inhibitor or angiotensin II receptor blocker, a β blocker, and an aldosterone blocker if not contraindicated. The following exclusion criteria were applied during patient selection: decompensated HF, ischemic HF, acute coronary syndrome, significant coronary artery stenosis (>50%), renal insufficiency with estimated glomerular filtration rate <30 ml/min/1.73 m 2 , myocarditis, muscular dystrophy, polymyositis, patients with cardiovascular implantable electronic device, and chronic inflammatory disease. Written informed consent was obtained from each patient before cardiac catheterization, and the study was approved by the Human Ethics Committee of our institution.
A 5Fr or 6Fr arterial cannula was placed in the radial or femoral artery, and a 6Fr venous sheath was placed in the right femoral vein. A coronary sinus (CS) catheter (Goodtec, Gifu, Japan) was advanced to the CS from the venous sheath, and its position was confirmed by fluoroscopy with contrast media. Blood samples were collected simultaneously from the aortic root (Ao) and CS. Right heart catheterization was performed using a 6F Swan-Ganz catheter (Fukuda Denshi, Tokyo, Japan) to measure hemodynamic parameters. Coronary angiography was then performed after administration of intracoronary isosorbidedinitrate to confirm the absence of significant epicardial coronary artery stenosis.
The serum and plasma samples were frozen at −80°C until analysis. Serum cTnT levels were measured using the Elecsys 2010 Troponin T hs kit (Roche Diagnostics, Indianapolis, Indiana). The lower limit of detection is 5 ng/L with a reported ninety-ninth percentile value in apparently healthy patients of 13.5 ng/L. At the ninety-ninth percentile value, the coefficient of variation is 9% by Elecsys 2010 analyzer. Plasma B-type natriuretic peptide (BNP) levels were measured using the MI02 Shionogi BNP kit (Shionogi, Osaka, Japan). Transcardiac cTnT and BNP releases from the myocardium were calculated as the differences between CS and Ao levels of cTnT (ΔcTnT [CS-Ao]) and BNP (ΔBNP [CS-Ao]), respectively.
CMR was performed on a 3.0 T MR instrument (Achieva 3.0 T X-series or Achieva 3.0 T X-series TX; Philips Medicals Systems, Best, The Netherlands). The patients were scanned in the supine position using a dedicated 6- and 32-channel cardiac torso coil, respectively, between January 2007 and April 2010 and between May 2010 and September 2013. Double-angulated scout images were obtained for planning cardiac axis views. In all patients, images were acquired using T1- and T2-weighted black blood, electrocardiogram-gated cine imaging by a segmented steady-state free-precession sequence in the 3 long cardiac axes, and LGE imaging. Approximately 10 minutes after the injection of 0.1 mmol/kg of a gadolinium-based contrast agent (Magnevist; Bayer Healthcare, Germany), we acquired 2-dimension inversion-recovery sequences that covered the left ventricle from the base to the apex. The imaging parameters were repetition time/echo time, 4.5/2.2 ms; inversion time, 250 to 350 ms; flip angle, 15°; field of view, 380 × 304 mm; acquisition matrix size, 1.19 × 1.94 mm for 6-channel coil and 0.95 × 1.13 mm for 32-channel coil; reconstruction matrix size, 0.74 × 0.75 mm; slice thickness, 8.0 mm; bandwidth, 428.9 Hz per pixel; sensitivity encoding factor, 2.
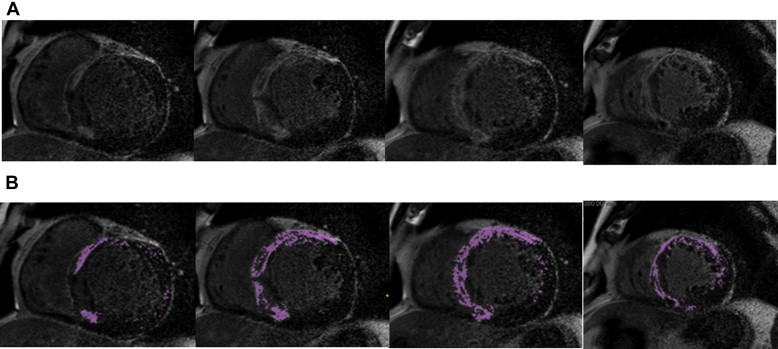
CMR data were analyzed using commercially available postprocessing software (AZE Virtual Place; AZE, Tokyo, Japan). The endocardial and epicardial borders of the myocardium were traced manually on each short-axis slice. Left ventricular volumes were calculated by subtracting endocardial volume from epicardial volume at end-diastole. A board-certified cardiovascular radiologist blinded to the results of biomarker analysis independently determined the dichotomous presence or absence of LGE in the left ventricle. Hyperenhanced myocardial voxels resembling LGE were defined as signal intensity higher than the 6 SDs above the mean intensity of the region of interest, which was placed over an area of the myocardium evaluated as normal. Quantitative measurement of the extent of myocardial fibrosis represented the sum of the hyper enhanced myocardial voxels from each of the short-axis images ( Figure 1 ) by 2 cardiologists blinded to the clinical data. %LGE was expressed as the percentage of LGE volume to total left ventricular volume.
Normally distributed parameters are presented as mean ± SD, whereas data of variables with skewed distribution are expressed as medians with interquartile ranges. Differences between groups were examined by the Student t or the Mann-Whitney U test for unpaired data. Categorical parameters are presented as numbers (percentage) and compared by the chi-square or Fisher’s exact test as appropriate. Parameters with a skewed distribution were transformed logarithmically before Pearson’s correlation to fulfill the conditions required for the types of analysis. Univariate logistic regression analysis was performed to identify significant parameters related to the positive LGE finding. Then, multivariate logistic regression analysis was performed using the forced inclusion model. The Hosmer-Lemeshow statistic was applied to assess model calibration. Linear relations between the extent of LGE and key variables were analyzed by univariate analysis. A 2-tailed value of p <0.05 was considered statistically significant. All statistical analyses were performed with the SPSS software, version 19 (SPSS Inc., Chicago, Illinois).
Results
Table 1 lists the baseline characteristics of the study patients. The serum cTnT levels were detectable (hs-cTnT >5 ng/L) in 65 patients with HF (88%). Of these, ΔcTnT (CS-Ao) levels were available (ΔcTnT [CS-Ao] >0 ng/L) in 60 patients (81%). cTnT levels in Ao (Ao-cTnT), representing the circulating cTnT levels, correlated positively with ΔcTnT (CS-Ao) levels (r = 0.517, p <0.001). Furthermore, ΔBNP (CS-Ao) levels were available in all study patients and were significantly higher in patients with available ΔcTnT (CS-Ao) levels than those without (249 [113–385] vs 124 [35–225] pg/ml, p = 0.01).
| Variable | n = 74 |
|---|---|
| Age (yrs) | 60 ± 15 |
| Men | 48 (65) |
| Body mass index (kg/m 2 ) | 23.9 ± 4.3 |
| New York Heart Association functional class (I/II/III/IV) | 21/45/8/0 |
| Hypertension ∗ | 40 (54) |
| Dyslipidemia † | 36 (49) |
| Diabetes mellitus | 12 (16) |
| Atrial fibrillation | 22 (30) |
| Previous HF hospitalization | 15 (20) |
| Hemodynamic status | |
| Cardiac index (L/min/m 2 ) | 2.37 ± 0.61 |
| PCWP (mm Hg) | 11.5 ± 4.7 |
| LVEDP (mm Hg) | 11.4 ± 7.0 |
| Laboratory and imaging findings | |
| cTnT level; detectable ‡ | 65 (88) |
| (cTnT level in CS) − (cTnT level in Ao); available § | 60 (81) |
| cTnT level in Ao (ng/L; n = 65) | 12.4 (9.7–20.7) |
| (cTnT level in CS) − (cTnT level in Ao) (ng/L; n = 60) | 3.2 (1.5–5.0) |
| BNP level in Ao (pg/ml) | 107 (52–251) |
| (BNP level in CS) − (BNP level in Ao) (pg/ml) | 223 (89–361) |
| Hemoglobin (g/dl) | 14.2 ± 1.9 |
| Hemoglobin A1c (%) | 6.0 ± 0.9 |
| Estimated glomerular filtration rate (ml/min/1.73 m 2 ) | 67 ± 17 |
| High-sensitivity C-reactive protein (mg/dl) | 0.08 (0.03–0.23) |
| Left ventricular ejection fraction (%) | 42.3 ± 12.5 |
| LGE; positive | 42 (57) |
| Etiology of HF | |
| Dilated cardiomyopathy | 38 (51) |
| Hypertrophic cardiomyopathy | 12 (16) |
| Hypertensive cardiomyopathy ¶ | 8 (11) |
| Others ‖ | 16 (22) |
| Medications | |
| Loop diuretics | 31 (42) |
| β blockers | 59 (80) |
| Angiotensin-converting enzyme inhibitors or angiotensin II receptor blockers | 61 (82) |
| Aldosterone antagonists | 31 (42) |
| Digitalis | 8 (11) |
∗ Defined as treated with antihypertensive drugs or blood pressure ≥140/90 mm Hg.
† Defined as treated with lipid-lowering drugs or low-density cholesterol ≥140 mg/dl and/or serum triglyceride ≥150 mg/dl and/or high-density cholesterol <40 mg/dl.
‡ Serum cTnT levels >5 ng/L (detection limit of hs-cTnT assay).
§ [(cTnT level in CS) − (cTnT level in Ao)] >0 ng/L in patients with detectable cTnT levels.
¶ Defined as a previous history of long-standing hypertension and presence of left ventricular hypertrophy (left ventricular mass index ≥101 g/m 2 in women and ≥117 g/m 2 in men) in the absence of a cause other than hypertension.
‖ Other etiologies included the followings: cardiac amyloidosis (n = 4), tachycardia-induced cardiomyopathy (n = 3), valvular heart disease (n = 2), diabetic cardiomyopathy (n = 2), left ventricular noncompaction (n = 2), unclassified cardiomyopathy (n = 2), and mitochondrial cardiomyopathy (n = 1).
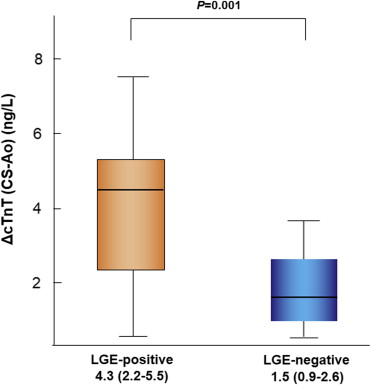
LGE was observed in 42 patients (57%; Table1 ). Table 2 compares the baseline characteristics of LGE-positive and LGE-negative patients. The percentages of patients with available ΔcTnT (CS-Ao) levels and those with Ao-cTnT of >13.5 ng/L were significantly higher in LGE-positive patients than in LGE-negative patients (98% vs 59%, p <0.001; 55% vs 21%, p = 0.004, respectively). Among patients with available ΔcTnT (CS-Ao) levels, ΔcTnT (CS-Ao) levels were also significantly higher in LGE-positive patients than in LGE-negative patients (4.3 [2.2–5.5] vs 1.5 [0.9–2.6] ng/ml, p = 0.001; Figure 2 ). Univariate and multivariate logistic regression analyses were performed to identify the independent parameters of LGE-positive finding in the study patients. Univariate analysis identified pulmonary capillary wedge pressure, Ao-cTnT >13.5 ng/L, availability of ΔcTnT (CS-Ao) levels, BNP levels in Ao (Ao-BNP), and ΔBNP (CS-Ao) levels correlated significantly with LGE-positive finding. Multivariate logistic regression analysis using forced inclusion model with age, gender, pulmonary capillary wedge pressure, Ao-cTnT >13.5 ng/L, availability of ΔcTnT (CS-Ao) levels, and ΔBNP (CS-Ao) levels identified pulmonary capillary wedge pressure (odds ratio 1.19, 95% confidence interval 1.02 to 1.40, p = 0.03) and availability of ΔcTnT (CS-Ao) levels (odds ratio 25.00, 95% confidence interval 2.56 to 243.96, p = 0.006) as independent and significant correlates with LGE-positive finding ( Table 3 ).
| Variable | LGE Positive (n = 42) | LGE Negative (n = 32) | p Value |
|---|---|---|---|
| Age (yrs) | 61 ± 16 | 59 ± 14 | 0.66 |
| Men | 29 (69) | 19 (59) | 0.39 |
| Body mass index (kg/m 2 ) | 23.9 ± 4.1 | 23.8 ± 4.6 | 0.85 |
| New York Heart Association functional class (I/II/III/IV) | 12/23/7/0 | 9/22/1/0 | |
| Hypertension | 24 (57) | 16 (50) | 0.54 |
| Dyslipidemia | 20 (48) | 16 (50) | 0.84 |
| Diabetes mellitus | 6 (14) | 6 (19) | 0.61 |
| Atrial fibrillation | 11 (26) | 11 (34) | 0.35 |
| Previous HF hospitalization | 9 (21) | 6 (19) | 0.78 |
| Hemodynamic status | |||
| Cardiac index (L/min/m 2 ) | 2.38 ± 0.69 | 2.36 ± 0.52 | 0.89 |
| PCWP (mm Hg) | 12.9 ± 4.8 | 9.8 ± 4.0 | 0.004 |
| LVEDP (mm Hg) | 12.5 ± 8.1 | 10.0 ± 4.9 | 0.10 |
| Laboratory and imaging findings | |||
| cTnT level in Ao ∗ (ng/L) | 13.9 (10.5–21.7) | 10.8 (8.4–16.0) | 0.047 |
| cTnT level in Ao >13.5 ng/L | 23 (55) | 7 (21) | 0.004 |
| (cTnT level in CS) − (cTnT level in Ao); available | 41 (98) | 19 (59) | <0.001 |
| BNP level in Ao (pg/ml) | 133 (62–338) | 82 (24–151) | 0.02 |
| (BNP level in CS) − (BNP level in Ao) (pg/ml) | 270 (158–440) | 137 (41–290) | 0.002 |
| Hemoglobin (g/dl) | 14.6 ± 1.8 | 13.8 ± 1.9 | 0.052 |
| Hemoglobin A1c (%) | 6.0 ± 0.8 | 6.1 ± 1.1 | 0.78 |
| Estimated glomerular filtration rate (ml/min/1.73 m 2 ) | 65 ± 17 | 69 ± 18 | 0.37 |
| High-sensitivity C-reactive protein (mg/dl) | 0.10 (0.06–0.20) | 0.05 (0.03–0.25) | 0.17 |
| Left ventricular ejection fraction (%) | 43.5 ± 13.5 | 40.8 ± 11.1 | 0.36 |
| Etiology of HF | |||
| Dilated cardiomyopathy | 16 (38) | 22 (69) | |
| Hypertrophic cardiomyopathy | 12 (29) | 0 (0) | |
| Hypertensive cardiomyopathy | 4 (10) | 4 (13) | |
| Others | 14 (33) | 6 (19) | |
| Medications | |||
| Loop diuretics | 17 (41) | 14 (44) | 0.77 |
| β blockers | 32 (76) | 27 (84) | 0.39 |
| Angiotensin-converting enzyme inhibitors or angiotensin II receptor blockers | 33 (79) | 28 (88) | 0.32 |
| Aldosterone antagonists | 19 (45) | 12 (38) | 0.50 |
| Digitalis | 3 (7) | 5 (16) | 0.28 |
∗ cTnT level in Ao was detected in every blood sample of LGE-positive patients and in 23 LGE-negative patients.
| Variables | Univariate Analysis | Multivariate Analysis | ||
|---|---|---|---|---|
| p Value | OR (95% CI) | p Value | OR (95% CI) | |
| Age (per yr) | 0.65 | 1.01 (0.98–1.04) | 0.81 | 1.01 (0.97–1.05) |
| Men (yes) | 0.39 | 1.53 (0.58–4.00) | 0.50 | 1.56 (0.43–5.65) |
| Body mass index (per kg/m 2 ) | 0.85 | 1.01 (0.91–1.13) | ||
| New York Heart Association functional class III (yes) | 0.10 | 6.21 (0.72–52.63) | ||
| Hypertension (yes) | 0.54 | 1.33 (0.53–3.36) | ||
| Dyslipidemia (yes) | 0.84 | 1.10 (0.44–2.76) | ||
| Diabetes mellitus (yes) | 0.61 | 0.72 (0.21–2.49) | ||
| Cardiac index (per L/min/m 2 ) | 0.89 | 1.05 (0.50–2.24) | ||
| PCWP (per mm Hg) | 0.007 | 1.18 (1.05–1.33) | 0.03 | 1.19 (1.02–1.40) |
| LVEDP (per mm Hg) | 0.13 | 1.06 (0.98–1.14) | ||
| cTnT level in Ao >13.5 ng/L (yes) | 0.006 | 4.33 (1.54–12.20) | 0.11 | 2.92 (0.80–10.64) |
| (cTnT level in CS) − (cTnT level in Ao); available (yes) | 0.002 | 28.05 (3.42–230.33) | 0.006 | 25.00 (2.56–243.96) |
| BNP level in Ao (per 10 pg/ml) | 0.04 | 1.04 (1.00–1.07) | ||
| (BNP level in CS) − (BNP level in Ao) (per 10 pg/ml) | 0.005 | 1.04 (1.01–1.08) | 0.15 | 1.03 (0.99–1.07) |
| Hemoglobin (per g/dl) | 0.06 | 1.30 (0.99–1.70) | ||
| Estimated glomerular filtration rate (per ml/min/1.73 m 2 ) | 0.99 | 0.99 (0.96–1.02) | ||
| Hemoglobin A1c (per %) | 0.78 | 0.93 (0.56–1.53) | ||
| High-sensitivity C-reactive protein (per mg/dl) | 0.60 | 1.55 (0.31–7.71) | ||
| Left ventricular ejection fraction (per %) | 0.36 | 1.02 (0.98–1.06) | ||
Stay updated, free articles. Join our Telegram channel

Full access? Get Clinical Tree


