ST-segment depression during exercise stress testing in asymptomatic subjects showing normal coronary arteries is considered a “false-positive” result. Coronary microvascular dysfunction, however, might be a possible cause of ST-segment depression in these cases. We assessed the coronary blood flow response to adenosine and to cold pressor test in the left anterior descending artery, using transthoracic Doppler echocardiography in 14 asymptomatic subjects with exercise-induced ST-segment depression and normal coronary arteries (group 1), 14 patients with microvascular angina (group 2), and 14 healthy subjects (group 3). Flow-mediated dilation was assessed in the brachial artery. Central pain processing was assessed using cortical laser evoked potentials during chest and right hand stimulation with 3 sequences of painful stimuli. The coronary blood flow response to adenosine was 1.8 ± 0.4, 1.9 ± 0.5, and 3.1 ± 0.9 in groups 1, 2, and 3, respectively (p <0.001). The corresponding coronary blood flow responses to the cold pressor test were 1.74 ± 0.4, 1.53 ± 0.3, and 2.3 ± 0.6 (p <0.001). The flow-mediated dilation was 5.5 ± 2.3%, 4.6 ± 2.4%, and 9.8 ± 1.2% in the 3 groups, respectively (p <0.001). The laser evoked potential N2/P2 wave amplitude decreased throughout the 3 sequences of stimulation in groups 1 and 3 but not in group 2 (chest, −19 ± 22%, +11 ± 42% and −36 ± 12%, p <0.001; right hand, −22 ± 25%, +12 ± 43% and −30 ± 20%, p = 0.009; in groups 1, 2, and 3). In conclusion, exercise stress test-induced ST-segment depression in asymptomatic subjects with normal coronary arteries cannot be considered as a simple false-positive result, because it can be related to coronary microvascular dysfunction. The different symptomatic state compared to patients with microvascular angina can, at least in part, be explained by differences in cortical processing of neural pain stimuli.
Exercise-induced ST-segment depression in patients with typical effort angina with normal coronary arteries by angiography has been shown to be related to coronary microvascular dysfunction (CMVD), a condition known as “microvascular angina” (MVA). Exercise-induced ST-segment depression in patients without any symptoms who also show normal coronary arteries by angiography is usually considered a “false-positive” result. However, in at least some of these patients, it might also be caused by CMVD and represent a totally silent form of “microvascular ischemia.” Totally silent myocardial ischemia is a well-known phenomenon also in patients with obstructive coronary artery disease. In patients with MVA, the occurrence of severe angina symptoms, despite the usually limited objective evidence of myocardial ischemia, has been suggested to be related to an increased painful perception of cardiac stimuli. The cause of this abnormal pain sensitivity, however, remains to be elucidated. In patients with MVA, we have previously shown an impairment of the “habituation” to painful stimuli that might contribute to the nociceptive abnormality. The primary aim of the present study was to investigate whether CMVD can be responsible for exercise-induced ST-segment depression in totally asymptomatic subjects with normal coronary arteries. Furthermore, we also assessed whether the difference in the symptomatic state of these subjects compared with patients with MVA might be related to differences in the cortical processing of pain stimuli.
Methods
We studied 3 groups of subjects. The first group (group 1) included 14 consecutive patients with positive exercise stress test findings and normal coronary arteries at angiography who were totally free of symptoms possibly related to cardiac disease. These patients were referred to our hospital from May 2009 to May 2010 to undergo coronary angiography because of the marked positivity of ≥2 exercise stress tests. The second group (group 2) included 14 patients consecutively enrolled at our outpatient ambulatory clinic among patients with known MVA (effort angina, positive exercise stress test results, angiographically normal coronary arteries). The third group (group 3) included 14 apparently healthy subjects without any history of chest pain who had normal maximal exercise stress test results. These subjects were enrolled from patients referred to our outpatient cardiology clinic for palpitations or evaluation of cardiovascular risk factors. The subjects of both groups 2 and 3 were selected to be comparable to the patients of group 1 with regard to age and gender.
The findings of standard 12-lead electrocardiography were normal for all subjects, and none had any evidence, from full clinical and laboratory investigations, of any other cardiac or noncardiac disease. Furthermore, the subjects with any disease possibly influencing pain perception (e.g., headache, any other chronic pain syndrome, diabetes) were excluded.
All subjects underwent an assessment of coronary microvascular function and peripheral vasodilator function. Furthermore, neurophysiologic assessment of cortical response to somatic painful stimuli by the recording of laser evoked potentials (LEPs) was also investigated. All tests were performed after appropriate washout of all medications; β blockers, in particular, were withdrawn ≥7 days before performing the study protocol. Sublingual nitrates were allowed to relieve the chest pain in those with MVA, but the tests were always performed ≥24 hours after the last nitrate consumption. All subjects were informed of the purpose and nature of the study and provided written, informed consent before participation.
Noninvasive assessment of coronary microvascular dilation in response to adenosine and the cold pressor test (CPT), which mainly assess endothelium-independent and endothelium-dependent vascular function, respectively, was performed in the morning, after an overnight fast by the same expert echocardiographer, according to methods previously described in detail. In brief, subjects were placed in the left lateral decubitus position in a quiet, temperature-controlled room (22°C). The left anterior descending coronary artery was imaged using a 7-MHz transducer connected to an Acuson Sequoia C512 ultrasound system (Siemens Spa, Milano, Italy), and the blood flow in its mid-distal tract was interrogated by color Doppler mapping. A 2.0-mm-wide sample volume was positioned on the color signal and basal Doppler spectral tracing of the diastolic left anterior descending coronary blood flow (CBF) velocity was recorded. Next, an infusion of adenosine (140 μg/kg/min) was given for 90 seconds during electrocardiographic and blood pressure monitoring, and the CBF velocity was measured at peak infusion.
At 15 minutes after adenosine administration and the return to basal heart rate and blood pressure values, a new basal CBF velocity was obtained. Next, the CPT was performed by putting the patient’s left hand into ice water for 120 seconds, and the CBF velocity was measured at the end of the test. For each measurement, the 3 greatest diastolic Doppler CBF velocity values were averaged. The coronary microvascular dilator response to adenosine and the CPT was measured as the ratio of the diastolic CBF velocity at the peak of each test to the respective basal CBF velocity value.
Peripheral vasodilator function was assessed in all subjects by the same expert operator using methods previously described in detail. Endothelium-dependent vasodilation was assessed by measuring flow-mediated dilation. In brief, the subjects rested in the supine position for ≥10 minutes in a warm, quiet room before testing. A 10-MHz multifrequency linear array probe attached to a high-resolution ultrasound machine (Siemens Acuson Sequoia) was used to acquire images of the right brachial artery. The brachial artery diameter was measured throughout the whole test using a totally automated system that identifies the internal edges of the vessel and tracks the walls of the artery by way of the brightness intensity of the walls versus the lumen of the vessel. A mechanical support keeps the probe in a fixed position, and the software provides a diameter measurement every second throughout the whole examination.
After baseline images of the brachial artery were obtained for 1 minute, a forearm cuff, positioned 1 cm under the antecubital fossa, was inflated to 250 mm Hg and released after 5 minutes, with consequent forearm reactive hyperemia. The basal diameter was defined as the average of all measures collected during the first minute, and flow-mediated dilation was calculated as the maximum percentage of change of the brachial artery diameter during hyperemia compared to the basal diameter. After recovery of the brachial artery diameter to basal values, endothelium-independent vasodilation was assessed by measuring nitrate-mediated dilation. To this aim, 25 μg of sublingual glyceryl trinitrate was given, and nitrate-mediated dilation was measured as the maximum percentage of change of the brachial artery diameter compared to the basal diameter.
The LEPs were always assessed in the afternoon (from 3:00 to 6.00 p.m. ) by the same expert neurologist, who was unaware of the clinical diagnosis, using methods previously described in detail. The stimulation site was visualized using a helium–neon laser beam. After each stimulus, the laser beam was slightly shifted to a nearby spot to avoid nociceptor sensitization and skin damage. Laser pulses (wavelength 10.6 mm, beam diameter 2 mm, duration 10 ms) were delivered by a carbon dioxide Neurolas (Electronic Engineering, Florence, Italy). The chest skin and right hand dorsum were stimulated in all subjects. The chest was chosen because the painful laser stimuli delivered on the chest skin are likely processed by the same dorsal horn neurons, which also process the nociceptive stimuli coming from the heart. The right hand was chosen because its nociceptive pathways are usually separate from those coming from the heart.
For each subject, we first identified the sensory threshold, defined as the lowest stimulus intensity required to elicit a distinct sensation. The stimulus intensity for the tests was set at 2.5 × sensory threshold, which was always clearly experienced as painful by all subjects. LEP recordings were obtained with 2 scalp electrodes placed along the midline in the frontal and vertex regions and 1 electrode in the left temporal region. The reference electrode was placed at the nose and the ground on the forehead. Eye movements and eye blinks were monitored by an electroculography derivation. Signals were amplified, filtered (bandpass 0.3 to 70 Hz), and stored for off-line averaging and analysis. The analysis time was 1,000 ms with a bin width of 2 ms. An automatic artifact rejection system excluded all trials contaminated by transient signals exceeding the average value by ±65 μV at any recording channel.
Three consecutive trains of 30 stimuli, with interstimulus intervals varying randomly from 8 to 12 seconds, were delivered to the chest and right hand dorsum in a random sequence. In each site, the impulse trains were separated by a 5-minute interval, and a 10-minute interval elapsed after the stimulation site was changed. Cortical pain signal processing in response to the 3 sequences of stimuli at each site was assessed, measuring the amplitude of the biphasic (negative-positive) complex of electrical cortical activity recorded from the midline electrodes (the N2/P2 wave) during laser stimulation; the amplitude of the N2/P2 wave was measured from the negative to the positive peak of the complex.
The distribution of continuous variables was assessed using the Kolmogorov-Smirnov test, and comparisons among groups were done by analysis of variance or the Kruskal-Wallis test, as indicated. In the case of global statistical significance, multiple comparisons were done by the unpaired t test or Mann-Whitney U test, with appropriate Bonferroni correction. Categorical variables were compared using the chi-square test. Differences among groups of changes in N2/P2 amplitudes across the 3 successive sequences of laser pulses at each stimulation site were compared by repeated measure 2-way analysis of variance. In the case of global statistical significance, multiple comparisons between groups were performed, with statistical results corrected by the Bonferroni rule. Data are reported as the mean ± SD or proportions. A 2-tailed p value <0.05 was considered statistically significant. Data were analyzed using the SPSS, version 17.0, statistical software (SPSS Italia, Florence, Italy).
Results
The main clinical characteristics of the patients and controls are summarized in Table 1 . There were no differences among groups with regard to age, gender, or cardiovascular risk factors. Also, no differences were seen between groups 1 and 2 with regard to drug therapy.
| Variable | Silent CMVD (n = 14) | MVA (n = 14) | Healthy Controls (n = 14) | p Value |
|---|---|---|---|---|
| Age (years) | 63 ± 12 | 61 ± 5 | 61 ± 3 | 0.48 |
| Gender | 0.74 | |||
| Men | 6 | 5 | 7 | |
| Women | 8 | 9 | 7 | |
| Family history of cardiovascular disease | 10 (71%) | 6 (43%) | 5 (36%) | 0.13 |
| Hypertension | 7 (50%) | 9 (64%) | 5 (36%) | 0.32 |
| Hypercholesterolemia | 8 (57%) | 7 (50%) | 5 (36%) | 0.51 |
| Active smoker | 5 (36%) | 3 (21%) | 2 (14%) | 0.39 |
| ≥1 Cardiovascular risk factors | 13 (93%) | 12 (86%) | 10 (71%) | 0.30 |
| Drug therapy | ||||
| β Blockers | 5 (36%) | 8 (57%) | — | |
| Calcium channel blockers | 4 (29%) | 5 (36%) | 4 (29%) | 0.89 |
| Nitrates | — | 4 (29%) | — | |
| Aspirin | 8 (57%) | 10 (71%) | — | |
| Angiotensin-converting enzyme inhibitors | 3 (21%) | 6 (43%) | 4 (29%) | 0.45 |
| Statins | 5 (36%) | 4 (29%) | 5 (36%) | 0.89 |
No subject developed angina or ST-segment changes during the adenosine and CPT tests. The heart rate did not differ among groups 1, 2, and 3 at rest (76 ± 3, 74 ± 2, and 75 ± 3 beats/min, respectively; p = 0.26), at peak adenosine (75 ± 3, 75 ± 3, and 74 ± 3 beats/min, respectively; p = 0.91), or at peak CPT (82 ± 2, 81 ± 3, and 81 ± 3 beats/min, respectively; p = 0.75). Similarly, the systolic blood pressure was similar among the 3 groups at rest (132 ± 5, 132 ± 4, and 143 ± 4 mm Hg, respectively; p = 0.51), at peak adenosine (133 ± 5, 132 ± 4, and 133 ± 5 mm Hg, respectively; p = 0.82), and at peak CPT (135 ± 6, 136 ± 5, and 136 ± 6 mm Hg, respectively; p = 0.88).
In contrast, the CBF response to adenosine differed significantly among the 3 groups (p <0.001). It was similarly reduced in groups 1 and 2 (1.8 ± 0.4 and 1.9 ± 0.5, respectively; p = 0.23) compared to group 3 (3.1 ± 0.9; p <0.001 vs groups 1 and 2, both; Figure 1 ).
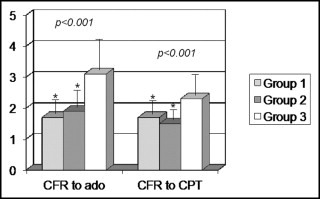
The CBF response to CPT also differed significantly among the 3 groups (p <0.001). It was similarly reduced in groups 1 and 2 (1.74 ± 0.4 and 1.53 ± 0.3, respectively; p = 0.10) compared to group 3 (2.3 ± 0.6; p <0.001 vs groups 1 and 2 both; Figure 1 ).
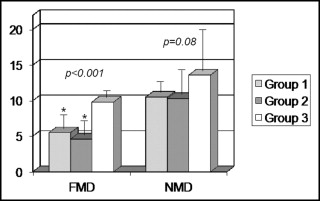
Flow-mediated dilation was significantly different among the 3 groups (p <0.001) and was similarly reduced in groups 1 and 2 (5.5 ± 2.3% and 4.6 ± 2.4%, respectively; p = 0.29) compared to group 3 (9.8 ± 1.2%; p <0.001 vs groups 1 and 2 both; Figure 2 ) . In contrast, nitrate-mediated dilation did not differ significantly among the 3 groups, although it tended to be lower in the 2 groups of patients (10.5 ± 1.5%, 10.3 ± 2.9%, and 13.6 ± 6% in groups 1, 2, and 3, respectively; p = 0.08; Figure 2 ).