coronary CT angiography are CT-dependent technical limitations in spatial and temporal resolution. Partial volume effect and beam hardening cause blooming artifacts especially in the presence of severe calcifications that hamper evaluation of the coronary artery lumen. Motion artifacts can be caused by postural motion (e.g., if the patient cannot hold the breath), by high heart rates that result in too short coronary rest-phase for motionless imaging, and by arrhythmia (causing reconstruction artifacts, Fig. 25.5) (16,17). The problems of arrhythmia can be overcome by fast coverage of the entire cardiac volume within a single heartbeat (Fig. 25.6). Arrhythmia rejection performed prospectively by the CT scanner is helpful to improve image quality while reducing effective dose as compared to retrospective gating techniques. Improving the coverage of coronary CT angiography and single heartbeat scanning can be done using either 320-row volume or fast dual-source CT (Fig. 25.7).
Table 25.1 Diagnostic Accuracy of Coronary CT Angiography on the Per-Patient Level | ||||||||||||||||||||||||||||||||||||||||||||||||||||||||||||||||||||||||
|---|---|---|---|---|---|---|---|---|---|---|---|---|---|---|---|---|---|---|---|---|---|---|---|---|---|---|---|---|---|---|---|---|---|---|---|---|---|---|---|---|---|---|---|---|---|---|---|---|---|---|---|---|---|---|---|---|---|---|---|---|---|---|---|---|---|---|---|---|---|---|---|---|
| ||||||||||||||||||||||||||||||||||||||||||||||||||||||||||||||||||||||||
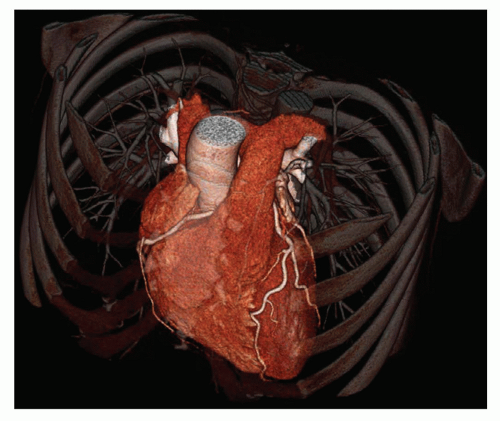 Figure 25.1. Three-dimensional display of an example of coronary CT angiography in which coronary artery disease could be reliably ruled out. |
64-row cardiac CT. Bolus tracking is most often used for initiating the scan after contrast agent injection (Fig. 25.8) (11). Alternatively, test bolus injection can be used to identify the optimal scan point but requires a slightly higher contrast agent volume (i.e., that of the test bolus itself). Bolus tracking is performed during the actual scan and thus has less variability. By using single-beat cardiac CT, the contrast agent volume can be further reduced in comparison to multi-beat 64-row CT. Further reductions in contrast agent volume can be achieved using fast bolus tracking approaches available with single-beat imaging.
The flow and contrast agent amount is adjusted to the individual patient weight to unify image quality.
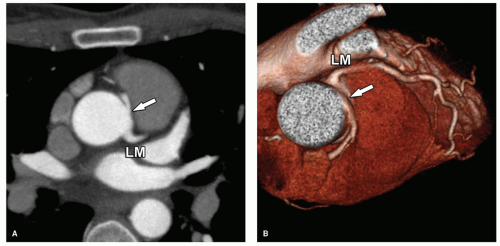 Figure 25.2. Malignant-type coronary artery anomaly with the right coronary artery arising from the left sinus of Valsalva (arrow, A,B). The anomalous right coronary artery may be compressed between the aorta and pulmonary trunk on its interarterial way. This is a case with a low interarterial course of the anomalous right coronary artery. Such low courses have been shown to lead less commonly than high courses to major adverse cardiac events. LM, left main coronary artery. |
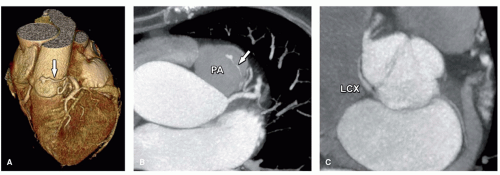 Figure 25.3. Left anterior descending coronary artery to pulmonary artery fistula and aberrant left circumflex coronary artery in a 74-year-old female patient. A,B: A small arteriovenous coronary artery fistula (arrow) from the proximal left anterior descending coronary artery to the pulmonary artery (PA). C: The course of an aberrant left circumflex artery (LCX) arising from the right sinus of Valsalva with a retro-aortic course continuing in its normal location in the left atrioventricular groove. Arteriovenous coronary artery fistulas are present in approximately 1/1,000 coronary angiographies. CT can be very useful and superior to invasive coronary angiography in determining the anatomic relationships between the involved structures. Arteriovenous fistulas bypass the myocardial tissue, which may cause symptoms (present in about half of the patients), depending on the size of the fistula and the shunt volume. |
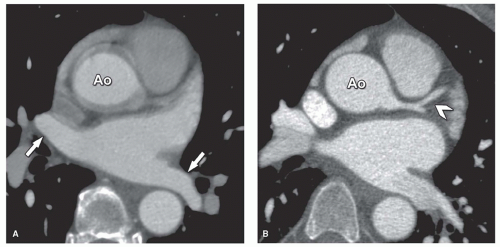 Figure 25.4. Effect of untriggered (A) versus ECG-triggered imaging (B) in a 52-year-old male patient with chronic atrial fibrillation. CT imaging of the heart was performed before radiofrequency ablation therapy of the pulmonary veins. The CT images are used as roadmap for guiding the procedure. This scan was repeated because the procedure had to be performed a second time. Before prospective triggering techniques became available, we used an untriggered (non-ECG-synchronized or gated) protocol for pulmonary vein imaging (A). With untriggered protocols, the pulmonary veins are already sharply displayed (arrows, A) because they hardly move in time. This is different from the ascending aorta (Ao) and coronary arteries that move substantially throughout the cardiac cycle and are only displayed without motion on ECG-synchronized imaging (B). Now that low-dose prospective ECG-triggering techniques have become available, we use these approaches for sharp imaging of the pulmonary veins and the coronary arteries as well (arrowhead, B), at approximately the same radiation dose. |
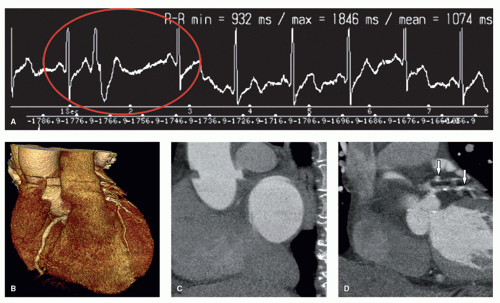 Figure 25.5. Issues with irregular heart rate in a 67-year-old female patient with suspected coronary artery disease who underwent 64-row CT that resulted in helical step-artifacts. The patient had an irregular heart rate during scanning (red circle, A), resulting in step-artifact through at the level of the aortic root (B-D). Some data are missing during image reconstruction because of a too short RR interval, whereas other data are projected twice because of one too large RR interval (i.e., double projected left main coronary artery; arrows, D). The result is a poor-quality scan with nondiagnostic results. |
 Figure 25.6. Successful arrhythmia rejection with 320-row CT (arrow, A) in a 49-year-old female patient with suspected coronary artery disease and irregular heart rate. Issues in patients with irregular heart rates shown in Figure 25.5 can be overcome using single-beat scanning of the entire heart with prospective triggering and arrhythmia rejection that allows for sharp imaging of the coronary arteries (B-D
Get Clinical Tree app for offline access
Stay updated, free articles. Join our Telegram channel
Full access? Get Clinical Tree


|