Patients with severe aortic stenosis and no obstructed coronary arteries are reported to have reduced coronary flow. Doppler evaluation of proximal coronary flow is feasible using transesophageal echocardiography. The present study aimed to assess the change in coronary flow in patients with severe aortic stenosis undergoing transcatheter aortic valve implantation (TAVI). The left main coronary artery was visualized using transesophageal echocardiography in 90 patients undergoing TAVI using the Edwards SAPIEN valve. The peak systolic and diastolic velocities of the coronary flow and the time-velocity integral were obtained before and after TAVI using pulse-wave Doppler. Mean aortic gradients decreased from 47.1 ± 15.7 mm Hg before TAVI to 3.6 ± 2.6 mm Hg after TAVI (p <0.001). The aortic valve area increased from 0.58 ± 0.17 to 1.99 ± 0.35 cm 2 (p <0.001). The cardiac output increased from 3.4 ± 1.1 to 3.8 ± 1.0 L/min (p <0.001). Left ventricular end-diastolic pressure (LVEDP) decreased from 19.8 ± 5.4 to 17.3 ± 4.1 mm Hg (p <0.001). The following coronary flow parameters increased significantly after TAVI: peak systolic velocity 24.2 ± 9.3 to 30.5 ± 14.9 cm/s (p <0.001), peak diastolic velocity 49.8 ± 16.9 to 53.7 ± 22.3 cm/s (p = 0.04), total velocity-time integral 26.7 ± 10.5 to 29.7 ± 14.1 cm (p = 0.002), and systolic velocity-time integral 6.1 ± 3.7 to 7.7 ± 5.0 cm (p = 0.001). Diastolic time-velocity integral increased from 20.6 ± 8.7 to 22.0 ± 10.1 cm (p = 0.04). Total velocity-time integral increased >10% in 43 patients (47.2%). Pearson’s correlation coefficient revealed the change in LVEDP as the best correlate of change in coronary flow (R = −0.41, p = 0.003). In conclusion, TAVI resulted in a significant increase in coronary flow. The change in coronary flow was associated mostly with a decrease in LVEDP.
Even in the absence of obstructive epicardial coronary artery disease, coronary flow reserve has been found to be impaired in patients with severe aortic stenosis. A number of studies have reported an improvement in this measurement after successful surgical aortic valve replacement. This improvement was detected by a change in coronary blood flow in response to adenosine or dipyridamole administration by means of thermodilution techniques or by transthoracic echocardiography. In patients with severe aortic stenosis, coronary blood flow has been shown to improve after aortic valve replacement by means of an intraoperative Doppler probe or by magnetic resonance imaging. Coronary flow can also be assessed during transesophageal echocardiography (TEE), with which Doppler techniques allow detection of flow within proximal coronary arteries. Its accuracy in estimating coronary blood flow velocity has been validated with Doppler wire measurement during cardiac catheterization. We recently reported a pilot study in which we demonstrated a significant increase in coronary flow using pulse-wave Doppler during TEE after transcatheter aortic valve implantation (TAVI). In the present report, we seek to confirm these observations in a larger patient cohort and to describe the clinical, echocardiographic, and hemodynamic factors associated with the changes in coronary flow.
Methods
We analyzed 154 consecutive patients with symptomatic severe aortic stenosis who underwent either transapical or transfemoral TAVI using the Edwards SAPIEN valve (Edwards Lifesciences, Irvine, California) from July 2008 to July 2010. Of these, 64 (41.5%) were excluded because of previous coronary artery bypass graft surgery (n = 44), poor image quality (n = 14), procedural failure or the patient was too unstable to obtain coronary flow (n = 4), and failure to obtain a TEE (n = 2). Of the 90 remaining patients, 60 (66.6%) underwent transfemoral TAVI and 30 (33.3%) transapical TAVI using the Edwards SAPIEN valve. Satisfactory imaging of the left main coronary artery was obtained before and after valve implantation.
For transfemoral TAVI, the femoral artery was accessed percutaneously and was closed using 2 Perclose ProGlide vascular suture-mediated closure devices (Abbott Vascular Devices, Redwood City, California). The access site was enlarged with serial dilators until the appropriate sheath size (22Fr or 24Fr) was reached. For transapical TAVI, a left minithoracotomy was performed, and 2 intramural pledget purse-string apical sutures were placed before apical puncture.
For anticoagulation, heparin was used to maintain an activated clotting time >250 seconds. A Swan-Ganz catheter and temporary pacemaker were placed. Cardiac output was measured by thermodilution technique before valve deployment. In all procedures, aortic valvuloplasty during rapid pacing was performed over an Amplatz Super Stiff guidewire (Boston Scientific, Natick, Massachusetts). Next, the bioprosthetic valve was advanced over the same wire and deployed under rapid pacing with fluoroscopic and TEE guidance.
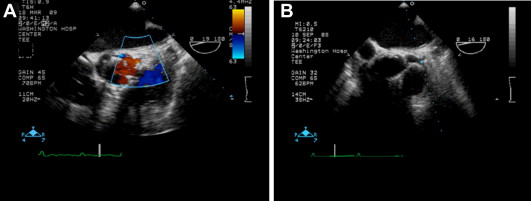
All patients underwent TEE using a 5-MHz probe (Sonos System 5500 or iE33; Philips, Andover, Massachusetts). The transducer was positioned in the upper esophagus so that a short-axis image of the aortic valve was obtained. Subsequently, the probe was withdrawn cranially until the left main coronary artery was seen along the bifurcation site. The left main coronary artery was localized in the transverse plane with color flow mapping. A “zoomed” image of the area of interest was obtained, and the TEE shaft was rotated to minimize the angle between the Doppler beam and the direction of the coronary blood flow ( Figure 1 ). A pulse-wave Doppler sample volume 5 mm in width was positioned over the portion of the left main coronary artery best aligned with ultrasound beam. The Doppler image was viewed using a 250- or 500-kHz filter, at a gain at which noise began to appear. Care was taken to position the pulse-wave Doppler sample in the same location before and after valve deployment.

Coronary flow was measured at the end of the procedure and after the patient had returned to a steady state so as to reduce, in so far as possible, the effect of reactive hyperemia resulting from any myocardial ischemia entailed by the procedure.
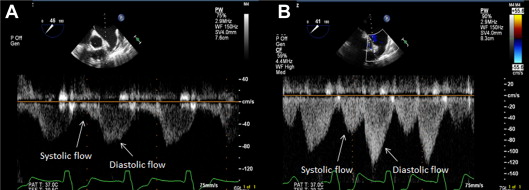
The following Doppler flow parameters were measured: peak systolic velocity (cm/s), peak diastolic velocity (cm/s), systolic velocity-time integral (cm), diastolic velocity-time integral (cm), and total velocity-time integral (cm) ( Figure 2 ). The final values of flow-velocity and time-velocity integrals represent an average of 3 cardiac cycles in patients in sinus rhythm and 5 cycles in patients in atrial fibrillation.

Statistical analysis was performed using SAS, version 9.1 (SAS Institute, Cary, North Carolina). Continuous variables are expressed as mean ± SD or median (twenty-fifth to seventy-fifth interquartile range), as appropriate, according to the variable distribution. Categorical variables are expressed as percentages. The Student t test was used to compare continuous variables, and the chi-square test or Fisher’s exact test was used to compare categorical variables. Paired data were assessed with the paired Student t test or Wilcoxon signed rank test as appropriate. The significance level was set at p <0.05. Correlation between the change in coronary flow and hemodynamic parameter was carried out using Spearman’s coefficient.
Results
Hemodynamic measurements at baseline and after valve implantation are listed in Table 1 . There were expected hemodynamic changes resulting from the relief of the aortic stenosis. The aortic valve area tripled from 0.58 to 1.99 cm 2 with a decrease in mean aortic systolic gradient, left ventricular end-diastolic pressure (LVEDP), and pulmonary systolic pressure and an increase in the cardiac output.
| Variable | Before TAVI (n = 90) | After TAVI (n = 90) | p Value |
|---|---|---|---|
| Systolic blood pressure (mm Hg) | 119.6 ± 20.3 | 134.2 ± 27.1 | <0.001 |
| Diastolic blood pressure (mm Hg) | 54.7 ± 12.6 | 55.3 ± 13.1 | 0.76 |
| Aortic valve area (cm 2 ) | 0.58 ± 0.17 | 1.99 ± 0.35 | <0.001 |
| Mean gradient across aortic valve (mm Hg) | 47.1 ± 15.7 | 3.6 ± 2.6 | <0.001 |
| Cardiac output (l/min) | 3.4 ± 1.1 | 3.8 ± 1.0 | <0.001 |
| Pulmonary artery systolic pressure (mm Hg) | 51.7 ± 16.2 | 46.4 ± 14.5 | <0.001 |
| Left ventricular systolic pressure (mm Hg) | 165.0 ± 26.0 | 138.8 ± 27.5 | <0.001 |
| Left ventricular end diastolic pressure (mm Hg) | 19.8 ± 5.4 | 17.3 ± 4.1 | <0.001 |
The following left main Doppler flow measurements increased significantly after TAVI ( Table 2 ): peak systolic velocity 24.2 ± 9.3 to 30.5 ± 14.9 cm/s (p <0.001), peak diastolic velocity 49.8 ± 16.9 to 53.7 ± 22.3 cm/s (p = 0.04), total velocity-time integral 26.7 ± 10.5 to 29.7 ± 14.1 cm (p = 0.002), and systolic velocity-time integral 6.1 ± 3.7 to 7.7 ± 5.0 cm (p = 0.001). Diastolic time-velocity integral increased from 20.6 ± 8.7 to 22.0 ± 10.1 cm (p = 0.04).
| Variable | Before TAVI (n = 90) | After TAVI (n = 90) | p Value |
|---|---|---|---|
| Peak systolic velocity (cm/s) | 24.2 ± 9.3 | 30.5 ± 14.9 | <0.001 |
| Peak diastolic velocity (cm/s) | 49.8 ± 16.9 | 53.7 ± 22.3 | 0.04 |
| Total velocity-time integral (cm) | 26.7 ± 10.5 | 29.7 ± 14.1 | 0.002 |
| Systolic velocity time integral (cm) | 6.1 ± 3.7 | 7.7 ± 5.0 | 0.001 |
| Diastolic time velocity integral (cm) | 20.6 ± 8.7 | 22.0 ± 10.1 | 0.04 |
Characteristics of the 43 patients (47.7%) in whom the total left main coronary flow velocity-time integral increased by ≥10% are compared in Tables 3 and 4 with those in whom such an increase did not occur. In terms of the baseline characteristics ( Table 3 ), only the frequency of atrial fibrillation was significantly different. It was more frequent (p = 0.004) in those in whom the flow-velocity integral failed to increase. Of the baseline hemodynamic and procedural variables ( Table 4 ), the only significant difference was a higher LVEDP in those whose flow rate increased after TAVI (p = 0.004).
| Variable | Coronary Flow Increase ≥10% (n = 43) | Coronary Flow <10% (n = 47) | p Value |
|---|---|---|---|
| Age (years) | 84.9 ± 5.0 | 86.5 ± 5.1 | 0.14 |
| Men | 15 (34.8%) | 18 (38.2%) | 0.73 |
| Society of Thoracic Surgeons score | 11.5 ± 3.1 | 11.9 ± 3.9 | 0.58 |
| Logistic EuroSCORE | 34.6 ± 22.0 | 42.1 ± 24.8 | 0.17 |
| Hypertension | 39 (90.7%) | 45 (95.7%) | 0.60 |
| Diabetes mellitus | 19 (44.1%) | 14 (29.7%) | 0.12 |
| Renal failure | 29 (67.4%) | 28 (59.5%) | 0.38 |
| Atrial fibrillation | 7 (16.2%) | 21 (44.6%) | 0.004 |
| Prior myocardial infarction | 6 (13.9%) | 7 (14.2%) | 0.93 |
| Ejection fraction (%) | 55.0 ± 12.0 | 54.9 ± 13.4 | 0.98 |
Stay updated, free articles. Join our Telegram channel

Full access? Get Clinical Tree


