, Alan Vainrib2, Rajesh Gupta3 and Michael Poon1
(1)
Department of Medicine and Radiology, Stony Brook University Hospital, Stony Brook, NY, USA
(2)
Department of Medicine, Stony Brook University Hospital, 100 Nicolls road, Stony Brook, NY, USA
(3)
Department of Radiology, Stony Brook University Hospital, 100 Nicolls road, Stony Brook, NY, USA
Electronic supplementary material
The online version of this chapter 10.1007/978-3-319-08168-7_4 contains supplementary material, which is available to authorized users.
4.1 Introduction
The application of cardiovascular CT imaging toward the detection, characterization, and prognostication of coronary artery disease (CAD) is one of the most rapidly evolving and exciting aspects of cardiovascular medicine. Coronary computed tomographic angiography (CCTA) has revolutionized the diagnosis and management of coronary artery disease by providing new methods for noninvasive imaging of coronary arteries. Coronary arterial calcification of plaques, plaque progression, stenosis characterization, plaque analysis, and appropriate use criteria will be presented below.
4.2 Coronary Arterial Calcification
4.2.1 Background
Coronary arterial calcification (CAC) signifies the presence of coronary atherosclerosis and as a result is associated with increased risk of cardiovascular events. Although CAC has been noted both anatomically and pathologically for centuries, it was first associated with a worse cardiovascular prognosis in the early 1980s using fluoroscopic imaging [1]. The emergence of electron beam CT(EBCT) revolutionized coronary calcium detection by providing the means for noninvasive detection and quantification. With improving spatial resolution and increased versatility, multidetector row CT scanners (MDCT) have replaced EBCT for the detection of coronary calcium. Using a standard method to quantify coronary calcification, this technology has provided a means for risk stratification beyond traditional Framingham risk factors.
4.2.2 Coronary Calcium Score
The method of standardizing the amount of coronary calcium present in the heart was devised by Arthur Agatston in the late 1980s. This technique uses a scoring system based on the peak density of calcium in a lesion, measured in Hounsfield units(HUs). A score of 1 is assigned for 130–199 HU, 2 for 200–299 HU, 3 for 300–399 HU, and 4 for 400 HU and greater. This weighted score is then multiplied by the area of calcification in a lesion. The total score of all lesions, as well as total score of each artery, is then added together and presented. A number of studies have classified the degree of coronary calcification and plaque burden based on the following scale: 0 – No identifiable disease, 1 to 99 – Mild disease, 100 to 399 – Moderate disease, ≥400 – Severe disease.
4.2.3 Use in Risk Stratification
Calcium scoring provides both diagnostic and prognostic information. Although plaque calcification does not raise the risk for plaque rupture, higher calcium scores are associated with an increased plaque burden and consequently an increased risk for acute coronary syndrome (ACS). In 8,855 initially asymptomatic adults 30–76 years old (26 % women) who self-referred for EBT CAC screening, elevated CAC was associated with an increased risk of coronary events at 37-month follow up (RR = 10.5, P < 0.001), above traditional risk factors of diabetes and smoking, especially in women [2].
Calcium scoring is associated with coronary arterial stenosis. Numerous studies looking at asymptomatic and symptomatic individuals have shown that CAC scoring is sensitive but not specific in predicting a >50 % stenosis on angiography. A 2000 ACC/AHA consensus statement presented data from 16 studies, approximating the sensitivity and specificity of EBCT at 91 and 49 %, respectively [3]. Additionally, the ACCURACY trial showed that the sensitivity and specificity for CAC >0, >100, and >400 were 98 and 42, 88 and 71, and 60 and 88 %, respectively.
Calcium scoring additionally has been shown to independently add prognostic information regarding CHD events and mortality to traditional Framingham risk factors, regardless of ethnicity [4, 5]. Calcium scoring additionally improves risk classification and information provided from the MESA cohort [6]. Risk classification is most improved in patients at intermediate risk based on Framingham data. In accordance with this, a consensus 2007 document from AHA/ACCF regarding calcium scoring suggests CAC for cardiovascular risk assessment in selected asymptomatic adults at intermediate risk (10–20 %, 10-year risk) by the Framingham risk score and modified Framingham/ATP risk scores when it is expected to change management if reclassified to a high or low risk group.
Despite an association with increased cardiovascular events, there is no evidence to date that suggests that pharmacological risk factor modification in asymptomatic patients with elevated CAC improves outcomes [7].
4.2.4 How High CAC Affects Interpretation of CTA
The size of a coronary calcification may be overestimated due to the partial volume effect, otherwise known as “blooming artifact.” This occurs when voxels surrounding a calcification that are only partially filled with calcification are mistakenly identified as having a higher attenuation value. This leads to an increased number of high attenuation voxels associated with a calcification and can consequently cause difficulty with the visualization of the coronary lumen [8]. Broadening the window level by increasing the window width, or similar to using bone window, can minimize blooming artifact and can improve the diagnostic value of CCTA. Despite this, it has been noted that the specificity is reduced in the presence of coronary artery calcium (86 versus 53 % for detection of ≥50 % stenosis with Agatston scores ≤400 versus >400) [9].
4.3 Types of Plaques
Plaques may be characterized based on their typical appearance. Intravenous contrast within an arterial lumen typically have attenuation coefficients between 200 and 400 Hounsfield units(HU). Structures outside the lumen that have lower attenuation than the lumen or are calcified are considered to be plaque. There are three main types of plaques: calcified, noncalcified, or partially calcified (mixed) [10]. Spotty calcification, a type of partial calcification associated with increased risk of rupture, has been defined as plaque with calcification less than 3 mm in size on curved multiplanar reformation images and occupying only one side on cross-sectional images [11].
4.4 Plaque Progression
Pathological observation has well delineated the mechanisms of progression of coronary plaque. Coronary arterial plaques begin with intimal thickening and xanthoma formation, then develop into fibrous-cap fibroatheromas, progress to thin-cap atheromas, and eventually undergo plaque rupture or erosion [12]. This progression is driven by inflammation. LDL is oxidized, promoting chemoattraction of macrophages that ultimately cause accumulation of cholesterol esters and free cholesterol. These lipid-laden macrophages then undergo apoptosis which leads to the formation and expansion of a necrotic plaque core. Poor clearance of necrotic cells increases plaque size, as well as intraplaque hemorrhage, and plaque healing with fibrosis. Increases in lesion burden compromise the vessel lumen only when greater than 40 % of cross-sectional luminal narrowing occurs [13]. Prior to this, plaques undergo a compensatory outward enlargement called positive remodeling (PR). Prior studies have defined PR as a change in the vessel diameter at a plaque site in comparison to the reference segment in normal-appearing vessel tissue proximal to the lesion. PR has been associated with increased risk of ACS [14]. Ultimately, repeated plaque rupture and progression leads to encroachment into the vessel wall considered negative remodeling (NR).
4.5 Degree of Stenosis
In comparison to quantitative invasive coronary angiography (QCA), CCTA predicts luminal stenosis with an accuracy of ±25 % [15]. Although tools for digital quantitative analysis of the degree of luminal stenosis, area stenosis, and plaque extent are available, their use has not improved interpretation precision. Consequently, the society for cardiovascular computed tomography(SCCT) recommends reporting quantitative luminal stenosis severity in broad ranges, in addition to qualitative terms(e.g., mild, moderate, severe) [16]. Currently, two quantification ranges are in use:
0 Normal: Absence of plaque and no luminal stenosis
1 Minimal: Plaque with <25 % stenosis
2 Mild: 25–49 % stenosis
3 Moderate: 50–69 % stenosis
4 Severe: 70–99 % stenosis
5 Occluded
0 Normal: Absence of plaque and no luminal stenosis
1 Mild: Plaque with <39 % stenosis
2 Moderate: 40–69 % stenosis
3 Severe: 70–99 % stenosis
4 Occluded
Although CCTA is rather accurate in identifying coronary stenosis, one of its limitations is its inability to assess the physiological significance of lesions. However, combining 16-slice CCTA with SPECT myocardial perfusion imaging has been shown to improve sensitivity and specificity of coronary lesions(e.g., 84–96 % and 74–95 %, respectively) [17]. A more recent further comparison of CCTA and SPECT MPI performed in the CORE320 study showed that CCTA had superior sensitivity and specificity for detecting >50 and >70 % stenoses on a per patient and per vessel basis when compared to SPECT MPI. Invasive QCA was used as the gold standard comparison test. The results of the trial are shown below [18].
Efficacy of 320-slice CCTA and SPECT MPI CAD detection
Sensitivity | Specificity | Positive predictive value | Negative predictive value | |
|---|---|---|---|---|
Per patient – 50 % stenosis | ||||
CCTA | 91 % | 74 % | 83 % | 85 % |
SPECT | 62 % | 67 % | 73 % | 55 % |
Per patient – 70 % stenosis | ||||
CCTA | 94 % | 60 % | 55 % | 92 % |
SPECT | 71 % | 67 % | 73 % | 73 % |
4.6 Plaque Analysis
CCTA has the unique ability to detect calcified and noncalcified coronary arterial plaque prior to the development of significant arterial luminal narrowing and clinical symptoms [19, 20]. An advantage of CCTA over conventional angiography is its ability to image the vessel wall and surrounding structures which can allow for detailed descriptions and characterizations of coronary plaques. Further, axial imagery, multiplanar reconstructions to the centerline of a vessel, as well as cross-sectional analysis allow for more in-depth plaque analysis. This has provided CCTA with the ability to detect plaques with characteristics associated with plaque rupture such as presence of thrombus, small residual lumen, greater plaque burden, and positive remodeling [21]. Other characteristics such as low plaque density and spotty calcification have been associated with increased risk of coronary events. Despite this, we do not yet have evidence to suggest changes in lifestyle and medical therapy can alter outcomes in patients who have plaques with these characteristics, and further study is warranted.
4.7 Cardiac CTA Post Revascularization
Revascularization in coronary artery disease is one of the most frequent medical procedures worldwide and can be performed with coronary artery bypass grafting or percutaneous stenting [22]. The follow-up evaluations of these procedures have typically been performed using conventional angiography. Advancements in coronary CTA technology allow noninvasive evaluations of coronary artery disease, graft and stent patency, as well as complications.
The advent of 64-slice MDCT and dual-source CT provides improved temporal and spatial resolution with reduction in both cardiac and respiratory motion allowing for accurate vessel analysis. Additionally, three-dimensional processing and advanced software reconstructions give physicians the ability to evaluate vessels in multiple planes and projections. Sensitivity and specificity values reach near 100 % for graft occlusion and high-grade stenosis [23]. This chapter will review coronary revascularization techniques, bypass graft anatomy, imaging protocols, as well as follow-up assessment of grafts and stents. Additionally, evaluation challenges, including artifacts and complications, will be briefly reviewed.
4.7.1 Coronary Artery Bypass Graft Surgery
Two main approaches for performing coronary artery bypass grafting include traditional on-pump surgery, which utilizes cardiopulmonary bypass and minimally invasive grafting through port access, and off-pump surgery without cardiopulmonary bypass [24]. Depending on the approach, different types of arterial and venous grafts can be used. Arterial grafts are preferred as they have better patency rates compared to venous grafts.
It is important for the physician interpreting the scan to know standard graft anatomy. Venous grafts are larger than native coronary arteries and arterial grafts and are less subjected to cardiac motion [22]. The left internal mammary artery is usually anastomosed to the left anterior descending artery (LAD), diagonals, and/or obtuse marginal branches. The standard connections of the right internal mammary artery graft are to the LAD, proximal right coronary artery, obtuse marginal branches, or diagonals. The great saphenous vein (GSV) and radial artery can be used as free grafts to any coronary artery as a single graft. The GSV is usually directly anastomosed to the aorta, while the radial artery is commonly attached to internal mammary grafts and less frequently to the aorta. The gastroepiploic artery is rarely used to revascularize the posterior descending artery or to extend a left internal mammary graft [24].
Long-term clinical outcome after surgery depends on patency of bypass grafts and progression of native coronary artery disease [23]. Coronary CTA provides an excellent noninvasive assessment of both. Imaging protocols to specifically assess grafts are similar to standard coronary CTA. One difference is that the scan requires a larger scan range to extend superiorly to include the origins of the internal mammary arteries or include the upper abdomen if a gastroepiploic graft was used [24]. With 64-MDCT, the scan duration and breath hold is approximately 15 s.
Bolus tracking of nonionic, iodinated, low-osmolar contrast is used for consistent results and homogenous opacification of the coronary arteries. Typically, an amount of approximately 60–100 ml of contrast followed by a saline flush is sufficient for bypass imaging using 64-MDCT [24]. Beta-adrenergic medications are used to maintain a heart rate <70 beats per second. In a case of a slow and stable heart rate, prospective ECG triggering is preferred as it can reduce radiation dose by up to 90 % [24]. Retrospective ECG gating is essential in cases of heart rate instability to obtain images in evenly spaced phases of the cardiac cycle [23]. Slice thickness and reconstruction field of view should be as small as possible.
Assessment of bypass grafts involves the identification of a homogeneous, contrast-enhanced graft lumen and graft wall that has a regular shape and border [23]. Analysis of the graft is usually divided into three segments, the origin or proximal anastomosis of the graft, the body of the graft, and the distal anastomosis. In cases where the distal anastomosis is not well evaluated, it is considered patent if contrast is identified within the graft lumen [23].
Prior reports utilizing electron beam CT (EBCT) have found that high-grade stenoses in venous grafts are located along the body of the graft and not in the region of the distal anastomosis [22]. It has been reported that detection of graft occlusion is difficult in venous grafts with the right coronary artery as the recipient vessel. Recipient vessel location influences graft survival. Grafts to the left anterior descending artery and a native vessel diameter >2 mm have the best survival [22].
Some challenges to bypass graft imaging include small vessel diameter, metal clip artifacts, and cardiac motion; however, the advanced 64-MDCT scanners can mitigate these challenges due to rapid acquisition times and increased spatial resolution [22]. The imager should be aware of bypass graft complications, which include graft thrombosis, malposition, vasospasm, and aneurysm. Within 1 month after surgery, thrombosis is the most common cause of graft failure and is due to platelet dysfunction at the site of endothelial damage related to surgical harvesting and anastomosis. After 1 year, atherosclerosis results in graft stenosis and occlusion; however, late IMA graft failure is usually due to disease progression in the native vessel distal to the anastomosis [23].
Coronary CTA can identify occluded grafts by nonvisualization of the graft. Other signs include a small outpouching of the most proximal part of an occluded graft from the ascending aorta as contrast may still fill the graft proximally. Also, part of an occluded graft may be visualized as a “ghost” [23]. The noninvasive evaluation of graft patency and native coronary artery disease progression is becoming more common due to advancements of CT scanner technology leading to increased accuracy, fast image acquisitions, and convenience of coronary vessel analysis.
4.7.2 Coronary Stents
The majority of coronary revascularization interventions involve placement of a coronary artery stent to provide scaffolding of the vessel wall [22]. There are substantial differences in the appearance of various stents on coronary CTA due to stent material, design, coating, and drug-eluting properties [25]. Many factors influence in-stent restenosis and thrombosis rates such as design, clinical scenario during placement, coronary anatomy, specific lesion morphology, and anticoagulant drugs [22].
Coronary stent sizes range from 2.5 to 5 mm and are chosen based on the diameter of the artery being treated. Most stents are made of metal struts and appear differently on CT based on strut material, design, and size. For example, visibility of the lumen is superior with magnesium struts compared with tantalum-coated stents. Additionally, drug-eluting stents are covered with polymer which stores the drug to be released within the first 2 months of implantation [25].
There are specific challenges involved with CT imaging of coronary stents. Technical issues include blooming artifacts due to beam hardening and partial volume effect, motion artifacts, geometric effects due to anatomy, and intravascular contrast enhancement. Beam hardening occurs when dense structures, like metallic material, rapidly absorb lower-energy photons of the X-ray beam causing the beam to be more intense once it reaches the detector [26]. Higher-energy photons are less sensitive to soft tissue and iodine attenuation causing CT density in surrounding soft tissue to appear “darker” than it should, and black streaks may occur [25].
Blooming artifact causes an apparent increase in strut size, thereby artificially narrowing the stent lumen. It is affected by beam hardening but is mainly due to partial volume effects. These effects are influenced by the reconstruction algorithm. When two different densities are included within a voxel like part of a metallic stent and the lumen, the average density of the two are displayed. The high CT density values of metal cause the average to always be higher than body tissue; thus, the window-level settings in CT angiography will rather resemble the stent struts. Improving spatial resolution leads to smaller voxels and decreases volume effects. Even with 64-MDCT and its ability for thinner slices and dedicated reconstruction kernels, artificial narrowing is still considerable at about 30–40 % [25]. Considerations to reduce metal artifacts include stents with thinner struts and those made of low-density metal like magnesium or cobalt–chromium alloys. Additionally, increasing the kV can minimize metal artifacts by avoiding the photon starvation effect. However, this increases radiation exposure to the patient and should be limited [26].
The use of 64-MDCT has greatly reduced issues regarding motion artifacts. Geometric effects from angulation of the stent to the scan plane affect the visibility of the lumen. It has been described that the lumen is best visible if the stent is positioned 0° or 90° to the z-axis; however, most coronary arteries course with angulation. Sufficient intravascular contrast enhancement, of more than 250 HU, is needed to counteract the negative effect of lower contrast-to-noise ratio from beam-hardening artifacts [26].
Imaging protocols must optimize temporal and spatial resolution given the specific challenges related to metallic stents. The best possible temporal resolution is achieved by optimal heart rate and positioning in the scanner as it is best to be of slower heart rate and at the center of the scan field. The scanner’s detector size will determine the thinnest possible slices and therefore the best spatial resolution. The smallest possible field of view is reconstructed for optimal coronary stent evaluation. Interpretation of coronary CTA for stent evaluation involves careful window-level settings [25].
Coronary CTA has evolved as a reliable tool for noninvasive detection of in-stent restenosis, stent thrombosis, and stent fractures. Although there are many potential applications, CT imaging of stents is considered clinically appropriate for risk assessment after revascularization in patients who were asymptomatic or have a history of left main coronary artery stenting and a stent diameter of 3 mm or more [26]. Continued advancements in CT technology, software reconstruction, and examination protocols will likely bring coronary CTA in the forefront as the primary diagnostic modality for revascularization evaluation.

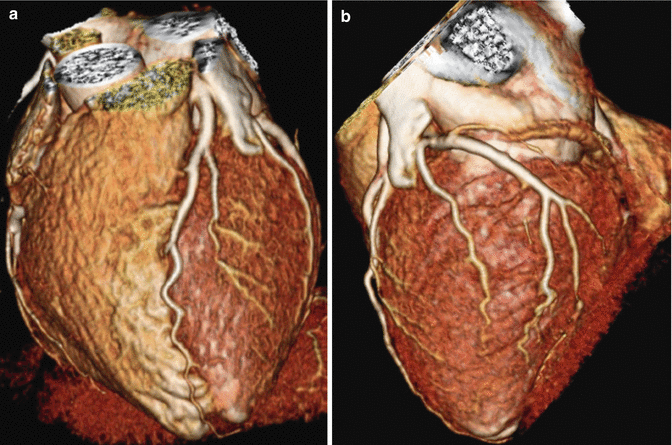
Fig. 4.1
(a) 3-dimensional volume rendered images of the heart demonstrating normal left anterior descending coronary arteries and its septal and diagonal branches. (b) 3D volume rendered images of the heart demonstrating normal left circumflex coronary artery and its obtuse marginal and posterolateral branches

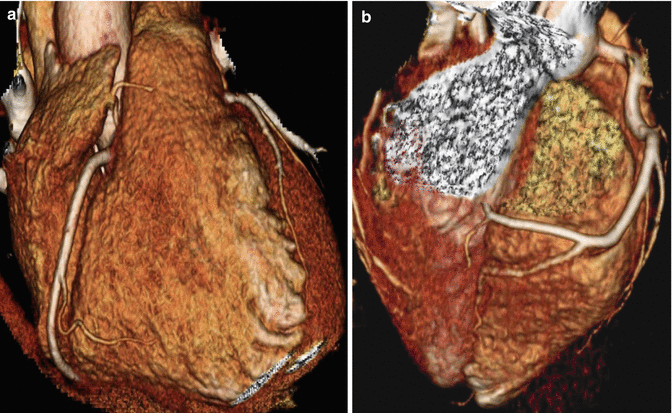
Fig. 4.2
(a, b) 3D volume rendered images demonstrating normal right coronary artery along with its branches conus, acute marginal and posterior descending arteries

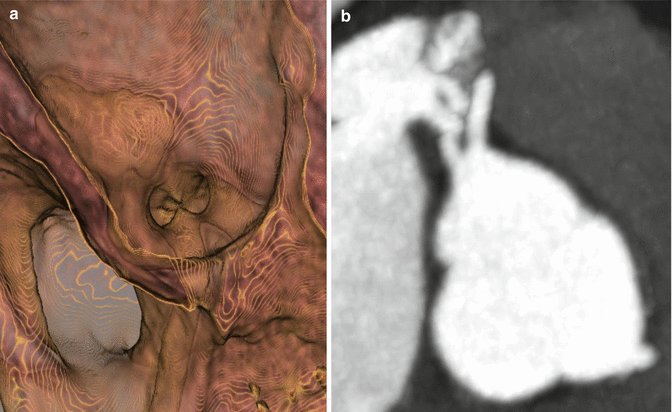
Fig. 4.3
(a) 3D Hollow volume rendered image from within the aorta demonstrating separate ostia of the LAD and LCX. (b) Multiplanar reformat image at the level of the aortic valve demonstrate separate ostia of the LAD and LCX from left coronary cusp

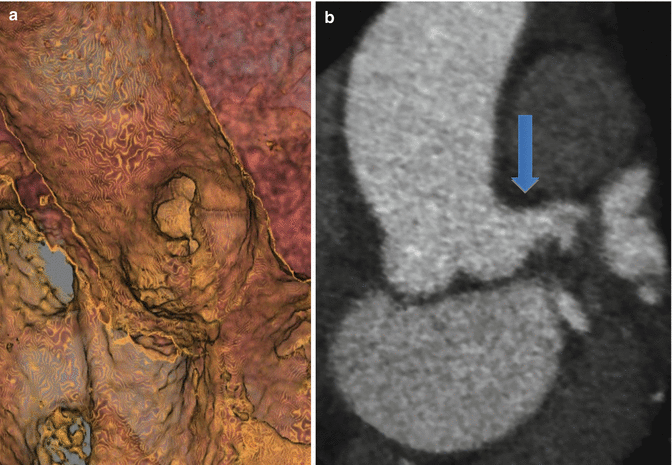
Fig. 4.4
(a) 3D hollow volume rendered image from within the aorta demonstrating a short left main (blue arrow) (compare to the prior image). (b) Multiplanar reformat image at the level of aortic valve demonstrating short left main originating from left coronary cusp
< div class='tao-gold-member'>
Only gold members can continue reading. Log In or Register to continue
Stay updated, free articles. Join our Telegram channel

Full access? Get Clinical Tree


