We examined the relations of central adiposity with left ventricular (LV) diastolic dysfunction in men and women who participated in the Baltimore Longitudinal Study of Aging, a prospective community-based study of older persons. The sample for this cross-sectional analysis included 399 women and 370 men. Central adiposity was estimated using the waist circumference (WC) and global adiposity using the body mass index (BMI). Using data from a comprehensive echocardiographic study that included tissue Doppler imaging, diastolic function was graded according to 3 parameters (E/A ratio, E/Em ratio, and left atrial volume index). In the logistic regression models adjusted for age, gender, cardiovascular risk factors, and hemodynamic parameters, WC and BMI were both independently associated with LV diastolic dysfunction. However, when both WC and BMI were in the same model, only WC remained significantly associated with LV diastolic dysfunction (odds ratio 1.04, 95% confidence interval 1.01 to 1.08, p = 0.02). In the gender-stratified analyses, WC was significantly associated with LV diastolic dysfunction—independently of BMI—in women (odds ratio 1.08, 95% confidence interval 1.04 to 1.14, p <0.001) but not in men (odds ratio 1.00, 95% confidence interval 0.95 to 1.05, p = 0.91). Additional adjustment for LV mass index failed to modify these relations. In conclusion, the adverse effect of central adiposity on LV diastolic function was independent of general adiposity and more pronounced among women. The effect of visceral adiposity on LV diastolic dysfunction would benefit from confirmation in longitudinal studies.
A number of studies have shown that measures of central adiposity such as waist circumference (WC) are superior to measures of global adiposity such as weight and body mass index (BMI) in assessing the risk of cardiovascular disease and all-cause and cardiovascular-specific mortality. WC has also been independently associated with left ventricular (LV) diastolic dysfunction, evaluated using the ratio of early-to-late transmitral velocity (E/A ratio) or semiquantitative categorical classification that combines multiple echocardiographic parameters beyond the E/A ratio to define the different patterns of LV diastolic dysfunction. However, the additive effect of WC over BMI on the grade of LV diastolic dysfunction remains unclear. In addition, because the fat quantity and anatomic distribution is quite different in men and women, the effect of body composition on LV diastolic function could be gender specific, but this hypothesis has not been previously tested. A better understanding of the link between central adiposity and LV diastolic dysfunction could help elucidate the mechanisms through which adiposity contributes to the risk of cardiovascular morbidity and mortality.
We evaluated the relation between WC and BMI with LV diastolic dysfunction in Baltimore Longitudinal Study of Aging (BLSA) participants. We hypothesized that (1) central adiposity is the main mediator of the relation between general adiposity and LV diastolic dysfunction, (2) the association of central adiposity with impaired LV relaxation is stronger than with other LV filling patterns, (3) the effect of central adiposity on LV diastolic dysfunction is different in men and women.
Methods
The study sample was a part of the BLSA, a prospective study of community-dwelling volunteers who undergo approximately 3 days of medical, physiologic, and psychological examinations at regular intervals of about 3 years. Healthy subjects have been recruited for the BLSA since its inception in 1957 according to rigid eligibility criteria. For the present cross-sectional analysis, we considered 1,140 participants who had undergone a comprehensive echocardiographic study that included tissue Doppler imaging. Of these, we excluded 58 participants because of (1) an electrocardiogram showing complete left bundle branch block or atrial flutter/fibrillation or pacemaker rhythm, (2) significant aortic or mitral valve stenosis or regurgitation (more than or equal to moderate), (3) systolic dysfunction, defined as LV ejection fraction <50%, and (4) a history of myocardial infarction, heart failure, and surgical or percutaneous cardiac revascularization after enrollment. Another 313 of the remaining subjects were excluded because of missing echocardiographic or clinical covariates, resulting in a final population of 769 participants. All participants received a detailed description of the study procedures and risks and provided written informed participation consent at each study visit.
The BMI, calculated as the weight (in kilograms) divided by the height (in square meters), was used as the index of general adiposity. WC, defined as the minimal abdominal circumference between the lower edge of the rib cage and the iliac crests, was measured according to a highly standardized procedure and was used as the index of the central adiposity. The brachial blood pressure was measured in triplicate immediately before echocardiography using an appropriately sized cuff, and the average of 3 systolic and diastolic blood pressure measurements was used in the analyses. The pulse pressure was computed as the systolic blood pressure minus the diastolic blood pressure. The heart rate was recorded before echocardiography from the electrocardiogram.
The medications taken by the BLSA participants were recorded at each visit according to the Anatomical Therapeutic Chemical classification system approved by the World Health Organization, and the codes related to the cardiovascular system (C codes) were considered for the present analysis.
Hypertension was defined as systolic blood pressure ≥140 mm Hg or diastolic blood pressure ≥90 mm Hg at the echocardiogram or the use of antihypertensive medications. Diabetes mellitus was diagnosed according to the 2011 American Diabetes Association criteria or the use of diabetes medications. Hypercholesterolemia was defined as total serum cholesterol of ≥200 mg/dl or the use of lipid-lowering treatment. Current and former smokers were merged into an “ever smoking” category, and “never smokers” were those who had smoked <100 cigarettes in their lifetime. The glomerular filtration rate, calculated using the simplified Modification of Diet in Renal Disease formula, was used to determine renal function, and renal failure was defined as a glomerular filtration rate of <60 ml/min at the index visit. The participants were identified as obese if their BMI was ≥30 kg/m 2 . Using the 2004 Adult Treatment Panel III criteria, abdominal obesity was defined as a waist circumference >102 cm in men and >88 cm in women.
All echocardiograms were performed by a single diagnostic cardiac sonographer with the same echocardiographic instrument (HP Sonos-5500, Philips, Andover, Massachusetts) using a standardized protocol and were interpreted by 2 experienced echocardiographers (S.S.N., J.B.S.).
The LV linear dimensions (LV end-diastolic diameter, LV end-systolic diameter) were measured from a parasternal long-axis view according to the guidelines and were used to determine the LV mass, relative wall thickness, fractional shortening, end-diastolic volume, end-systolic volume, and LV ejection fraction, as previously described.
Diastolic function was assessed by pulsewave Doppler examination of mitral inflow (peak E wave, peak A wave, E/A ratio, deceleration time of the E wave, deceleration time) and LV outflow (isovolumetric relaxation time). Tissue Doppler systolic (Sm), early (Em), and late (Am) diastolic velocities of the medial and lateral mitral annulus were recorded and averaged, as recommended by the guidelines. The left atrial volume was measured by planimetry in the apical 4-chamber view. All the functional parameters were measured on-line and off-line and in triplicate and averaged. The left atrial volume and LV mass were indexed to the body surface area.
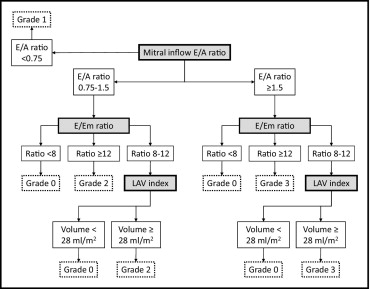
The LV diastolic dysfunction was graded on a 4-point ordinal scale, according to the algorithm illustrated in Figure 1 , incorporating 3 different diastolic parameters, including the E/A ratio, E/Em ratio, and left atrial volume index. The E/A ratio has been used extensively to grade LV diastolic dysfunction and is categorized into 1 of 3 mitral inflow patterns, including normal (E/A ratio 0.75 to 1.5), impaired LV relaxation (E/A ratio <0.75), and pseudonormal/restrictive LV filling (E/A ratio ≥1.5). However, there are subjects with normal diastolic function but an E/A ratio ≥1.5 that make it difficult to differentiate by mitral inflow velocities alone. Therefore, European and American guidelines recommend a multiparametric evaluation of LV diastolic function, according to the scheme initially proposed by Redfield et al. This approach enabled classification of diastolic function into the 4 current categories: normal or grade 0 LV diastolic dysfunction, mild or grade 1 LV diastolic dysfunction (impaired relaxation pattern), moderate or grade 2 LV diastolic dysfunction (pseudonormal LV filling), and severe or grade 3 LV diastolic dysfunction (restrictive LV filling). In our study, the ratio between the mitral inflow E velocity and tissue Doppler Em velocity (E/Em ratio) was calculated as an index of the LV filling pressures, and an E/Em ratio ≥12 was associated with increased LV filling pressures. Because the left atrial volume index reflects the cumulative effects of filling pressures over time, the left atrial volume index was used instead of the E/Em ratio when the E/Em ratio was 8 to 12. According to the guidelines, we used 28 ml/m 2 as the normal cutoff for the left atrial volume indexed to the body surface area.
All analyses were performed using the SAS package, version 9.2 (SAS Institute, Cary, North Carolina). Continuous variables are presented as the mean ± SD, and the categorical variables are presented as the absolute and/or relative frequencies. Comparisons between men and women were performed using Student’s independent sample t tests for continuous variables. Categorical variables were compared by chi-square tests. Spearman’s correlation analyses were performed to determine the association of WC and BMI with continuous parameters of diastolic function in both genders. An independent association of BMI (analyses 1 and 4) and WC (analyses 2 and 5) with LV diastolic dysfunction was determined in the overall sample using binary and multinomial multivariate logistic regression analysis to assess the risk of LV diastolic dysfunction and specific grades/patterns of LV diastolic dysfunction associated with general and central adiposity, respectively. All models were adjusted for the following covariates: age, gender (only for overall sample analysis), cardiovascular risk factors (including smoking, diabetes, hypertension, hypercholesterolemia, and renal failure), and hemodynamic parameters (heart rate and pulse pressure). To test whether central adiposity could explain the relation between general adiposity and LV diastolic dysfunction, the BMI and WC were mutually adjusted in the final models (analyses 3 and 6). The interaction of WC or BMI with gender was assessed in all the analyses and, when significant, gender-stratified analyses were performed. The difference in the mean LV mass index across the LV diastolic dysfunction groups was analyzed with analysis of variance, and the Tukey-Kramer test was used for multiple comparisons among groups. All tests were considered significant at p <0.05.
Results
The comparison between men and women with regard to the demographic and clinical variables is presented in Table 1 . In general, men were significantly older and were more likely to be white. No significant difference was found between the groups for BMI. The mean WC was in the normal range for both genders. Men had a greater prevalence of hypertension, diabetes, and smoking than the women and the same prevalence of obesity, abdominal obesity, hypercholesterolemia, and renal failure. No difference was found in the proportion of subjects taking drugs acting directly on cardiac muscle contraction and relaxation and potentially interfering with our LV diastolic dysfunction estimation ( Table 1 ).
| Characteristic | Overall (n = 769) | Men (n = 370) | Women (n = 399) |
|---|---|---|---|
| Age (years) | 64 ± 13 | 66 ± 13 | 62 ± 13 ⁎ |
| Race | |||
| White | 64% | 71% | 59% † |
| Black | 29% | 24% | 33% † |
| Other | 7% | 5% | 8% |
| Body mass index (kg/m 2 ) | 27 ± 5 | 27 ± 4 | 27 ± 5 |
| Waist circumference (cm) | 92 ± 12 | 99 ± 10 | 85 ± 11 ‡ |
| Systolic blood pressure (mm Hg) | 120 ± 17 | 124 ± 15 | 117 ± 17 ‡ |
| Diastolic blood pressure (mm Hg) | 67 ± 9 | 70 ± 8 | 65 ± 9 ‡ |
| Pulse pressure (mm Hg) | 53 ± 13 | 54 ± 13 | 52 ± 14 |
| Heart rate (beats/min) | 66 ± 11 | 65 ± 11 | 67 ± 10 ⁎ |
| Total cholesterol (mg/dl) | 193 ± 36 | 186 ± 35 | 199 ± 36 † |
| Glomerular filtration rate (ml/min) | 78 ± 17 | 78 ± 17 | 77 ± 17 |
| Smoker (ever) | 47% | 56% | 38% ‡ |
| Diabetes mellitus | 11% | 16% | 7% ⁎ |
| Obesity | 23% | 23% | 23% |
| Abdominal obesity | 34% | 34% | 35% |
| Hypertension | 45% | 52% | 39% ⁎ |
| Hypercholesterolemia | 49% | 52% | 47% |
| Renal failure | 11% | 9% | 13% |
| Medications, ATC code | |||
| Cardiac therapy, C01 | 13% | 11% | 14% |
| Diuretics, C03 | 14% | 14% | 14% |
| β-blocking agents, C07 | 15% | 17% | 12% |
| Calcium channel blockers, C08 | 10% | 11% | 9% |
| Renin-angiotensin system, C09 | 24% | 28% | 19% † |
| Lipid modifying, C10 | 38% | 42% | 34% † |
The echocardiographic findings between the 2 groups are listed in Table 2 . Women had greater E velocities and lower late diastolic and systolic velocities of the mitral annulus. In terms of diastolic function, no significant gender differences were found in the E/A ratio or E/Em ratio. However, men had a more prolonged isovolumetric relaxation time and deceleration time. As expected, women had a smaller left atrial volume index, LV end-systolic and end-diastolic diameter, relative wall thickness, and LV mass index. Systolic function (evaluated by fractional shortening and LV ejection fraction) was comparable between the genders. The prevalence of any grade of LV diastolic dysfunction was 31% (n = 242) in the overall sample. Diastolic dysfunction was present in 29% of the women and 34% of the men (p = NS), and the distribution of LV diastolic dysfunction categories was similar in the 2 groups ( Table 2 ). Because only 7 subjects (4 men and 3 women) had grade 3 LV diastolic dysfunction (a restrictive pattern associated with more severe cardiac disease and a worse prognosis), they were excluded from the subsequent analyses.
| Variable | Overall (n = 769) | Men (n = 370) | Women (n = 399) |
|---|---|---|---|
| Early transmitral velocity (E, cm/s) | 76.7 ± 17.3 | 71.8 ± 16.5 | 79.2 ± 17.3 ⁎ |
| Late transmitral velocity (A, cm/s) | 77.0 ± 18.5 | 75.3 ± 18 | 78.4 ± 18.8 |
| E/A ratio | 1.0 ± 0.4 | 1.0 ± 0.4 | 1.1 ± 0.3 |
| Systolic mitral annulus velocity (Sm, cm/s) | 8.4 ± 1.6 | 8.7 ± 1.7 | 8.2 ± 1.5 ⁎ |
| Early diastolic mitral annulus velocity (Em, cm/s) | 9.7 ± 2.4 | 9.5 ± 2.4 | 9.9 ± 2.4 |
| Late diastolic mitral annulus velocity (Am, cm/s) | 9.8 ± 2.1 | 10.2 ± 2.1 | 9.4 ± 2.1 ⁎ |
| E/Em ratio | 8.2 ± 2.4 | 8.0 ± 2.3 | 8.4 ± 2.6 |
| Em/Am ratio | 1.3 ± 0.5 | 1.4 ± 0.5 | 1.2 ± 0.4 ⁎ |
| Isovolumetric relaxation time (ms) | 80 ± 19 | 82 ± 22 | 79 ± 16 † |
| Deceleration time (ms) | 225 ± 52 | 233 ± 54 | 217 ± 48 ‡ |
| Left atrial volume indexed to body surface area (ml/m 2 ) | 21 ± 13 | 23 ± 15 | 19 ± 11 ‡ |
| Left ventricular end-diastolic diameter (mm) | 44 ± 1 | 46 ± 6 | 43 ± 5 ⁎ |
| Left ventricular end-systolic diameter (mm) | 28 ± 1 | 29 ± 5 | 27 ± 4 ⁎ |
| Relative wall thickness | 0.44 ± 0.1 | 0.5 ± 0.1 | 0.4 ± 0.1 ⁎ |
| Fractional shortening (%) | 37 ± 8 | 36 ± 7 | 37 ± 8 |
| Left ventricular end-diastolic volume (ml) | 91 ± 27 | 99 ± 29 | 83 ± 22 ⁎ |
| Left ventricular ejection fraction (%) | 66 ± 10 | 65 ± 10 | 67 ± 10 |
| Left ventricular mass indexed to body surface area (g/m 2 ) | 76.8 ± 25.6 | 84.8 ± 27.2 | 69.3 ± 21.6 ⁎ |
| Diastolic function categories | |||
| Grade 0, normal | 527 (69%) | 243 (66%) | 284 (71%) |
| Grade 1, mild | 147 (19%) | 81 (22%) | 66 (17%) |
| Grade 2, moderate | 88 (11%) | 42 (11%) | 46 (11%) |
| Grade 3, severe | 7 (1%) | 4 (1%) | 3 (1%) |
Figure 2 shows the unadjusted Spearman’s correlation coefficients between the indexes of adiposity and diastolic function parameters by gender. The associations of WC with the E/A ratio, E/Em ratio, and left atrial volume were all significant in both men and women ( Figure 2 ), and the strength of the associations was similar between the genders. No significant correlation was found between the WC and isovolumetric relaxation time (women, r s = 0.01, p = 0.77; men, r s = −0.03, p = 0.53), deceleration time (women, r s = 0.11, p = 0.11; men, r s = 0.08, p = 0.23), and Em/Am ratio (women, r s = −0.06, p = 0.23; men, r s = −0.10, p = 0.08).
Among women, the E/A ratio, E/Em ratio, and left atrial volume all significantly correlated with the BMI. However, among men, only the E/Em ratio correlated significantly with the BMI ( Figure 2 ). The correlation of the E/A ratio and left atrial volume with the BMI in men was in the same direction as in women, but the strength of the associations was weaker in men and not statistically significant. No significant correlation was found between the BMI and the isovolumetric relaxation time (women, r s = −0.02, p = 0.75; men, r s = −0.06, p = 0.26), deceleration time (women, r s = −0.005, p = 0.93; men, r s = −0.03, p = 0.69), and Em/Am ratio (women, r s = −0.06, p = 0.22; men, r s = −0.10, p = 0.06).
In the binary logistic analysis, after adjusting for age, gender, cardiovascular risk factors, and hemodynamic parameters, the participants with a greater BMI and higher WC were more likely to have LV diastolic dysfunction ( Table 3 , analyses 1 and 2). A trend for interaction was noted between gender and WC (p for interaction = 0.08, analysis 2) but not between gender and BMI (p for interaction = 0.47, analysis 1). In the analysis stratified by gender, WC was significantly associated with LV diastolic dysfunction in women but not in men ( Table 3 , analysis 2).
| Variable | Overall | Women | Men | ||||||
|---|---|---|---|---|---|---|---|---|---|
| OR | 95% CI | p Value | OR | 95% CI | p Value | OR | 95% CI | p Value | |
| Relation between BMI and WC and LV diastolic dysfunction ⁎ | |||||||||
| Analysis 1 | |||||||||
| BMI | 1.07 | 1.03–1.12 | <.001 | 1.09 | 1.04–1.15 | <.001 | 1.06 | 0.99–1.13 | 0.10 |
| Analysis 2 | |||||||||
| WC | 1.04 | 1.02–1.06 | <.0001 | 1.06 | 1.03–1.09 | <.0001 | 1.02 | 0.99–1.05 | 0.12 |
| Analysis 3 | |||||||||
| WC | 1.04 | 1.01–1.08 | 0.02 | 1.08 | 1.04–1.14 | <.001 | 1.00 | 0.95–1.05 | 0.91 |
| BMI | 1.00 | 0.93–1.07 | 0.98 | 0.95 | 0.86–1.04 | 0.27 | 1.06 | 0.94–1.20 | 0.33 |
| Relation between BMI and WC with different grades of LV diastolic dysfunction ⁎ | |||||||||
| Analysis 4 | |||||||||
| BMI, grade 0–1 | 1.09 | 1.04–1.14 | <.001 | 1.11 | 1.04–1.17 | <.001 | 1.06 | 0.98–1.15 | 0.12 |
| BMI, grade 0–2 | 1.07 | 1.01–1.13 | 0.02 | 1.08 | 1.01–1.15 | 0.03 | 1.06 | 0.96–1.17 | 0.23 |
| BMI, grade 1–2 | 0.98 | 0.92–1.04 | 0.56 | 0.97 | 0.90–1.05 | 0.52 | 1.00 | 0.90–1.11 | 0.97 |
| Analysis 5 | |||||||||
| WC, grade 0–1 | 1.04 | 1.02–1.07 | <.001 | 1.07 | 1.04–1.10 | <.0001 | 1.02 | 0.99–1.06 | 0.23 |
| WC, grade 0–2 | 1.03 | 1.01–1.06 | <.01 | 1.05 | 1.02–1.09 | <.01 | 1.03 | 0.99–1.08 | 0.12 |
| WC, grade 1–2 | 0.99 | 0.96–1.02 | 0.46 | 0.98 | 0.95–1.02 | 0.45 | 1.01 | 0.97–1.06 | 0.61 |
| Analysis 6 | |||||||||
| WC, grade 0–1 | 1.04 | 1.00–1.08 | 0.04 | 1.09 | 1.03–1.16 | <.01 | 0.99 | 0.93–1.05 | 0.74 |
| BMI, grade 0–1 | 1.01 | 0.93–1.10 | 0.83 | 0.94 | 0.84–1.06 | 0.31 | 1.09 | 0.95–1.25 | 0.21 |
| WC, grade 0–2 | 1.04 | 0.99–1.09 | 0.06 | 1.07 | 1.01–1.14 | 0.02 | 1.03 | 0.96–1.10 | 0.47 |
| BMI, grade 0–2 | 0.99 | 0.90–1.09 | 0.85 | 0.95 | 0.84–1.08 | 0.47 | 1.03 | 0.86–1.21 | 0.83 |
| WC, grade 1–2 | 1.00 | 0.95–1.05 | 0.95 | 0.98 | 0.91–1.05 | 0.57 | 1.04 | 0.96–1.12 | 0.37 |
| BMI, grade 1–2 | 0.98 | 0.88–1.10 | 0.74 | 1.01 | 0.88–1.17 | 0.87 | 0.93 | 0.77–1.13 | 0.47 |
Stay updated, free articles. Join our Telegram channel

Full access? Get Clinical Tree


