Figure 43.2 Parasternal short-axis view with color Doppler illustrating patent duct artery between descending aorta and left pulmonary artery. AO, aorta; DAO, descending aorta; LPA, left pulmonary artery; MPA, main pulmonary artery; PDA, patent duct artery; RPA, right pulmonary artery.
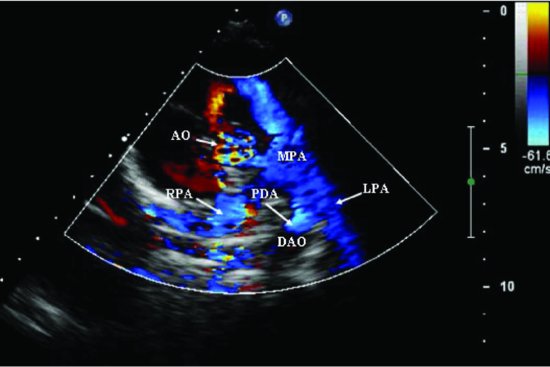
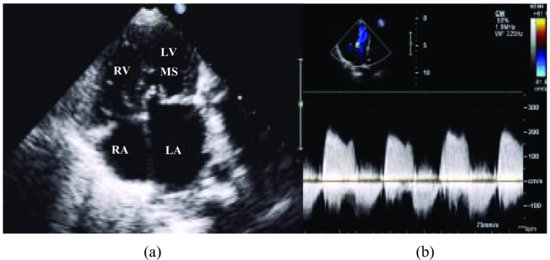
Figure 43.3 Apical 4-chamber view shows the stenosis of the mitral valves caused by valvular deformation (a). Continuous wave Doppler recordings of mitral valvular jet velocity from the apical 4-chamber view. The peak velocity was 2.27 m/sec and the maximal gradient was 20.6 mmHg (b). LA, left atrium; LV, left ventricle; MS, mitral valve stenosis; RA, right atrium; RV, right ventricle.
The diagnosis of IAA in this patient was confirmed by three-dimensional computed tomography angiography and aortic angiography.
Management
Stay updated, free articles. Join our Telegram channel

Full access? Get Clinical Tree


