Verticalization of the P-wave axis is characteristic of chronic obstructive pulmonary disease (COPD). We studied the correlation of P-wave axis and computerized tomographically quantified emphysema in patients with COPD/emphysema. Individual correlation of P-wave axis with different structural types of emphysema was also studied. High-resolution computerized tomographic scans of 23 patients >45 years old with known COPD were reviewed to assess the type and extent of emphysema using computerized tomographic densitometric parameters. Electrocardiograms were then independently reviewed and the P-wave axis was calculated in customary fashion. Degree of the P vector (DOPV) and radiographic percent emphysematous area (RPEA) were compared for statistical correlation. The P vector and RPEA were also directly compared to the forced expiratory volume at 1 second. RPEA and the P vector had a significant positive correlation in all patients (r = +0.77, p <0.0001) but correlation was very strong in patients with predominant lower lobe emphysema (r = +0.89, p <0.001). Forced expiratory volume at 1 second and the P vector had almost a linear inverse correlation in predominantly lower lobe emphysema (r = −0.92, p <0.001). DOPV positively correlated with radiographically quantified emphysema. DOPV and RPEA were strong predictors of qualitative lung function in patients with predominantly lower lobe emphysema. In conclusion, a combination of high DOPV and predominantly lower lobe emphysema indicates severe obstructive lung dysfunction in patients with COPD.
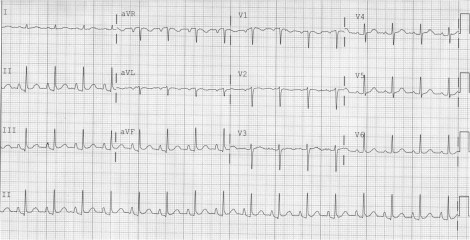
Emphysema of any pathogenesis, nearly always caused by chronic obstructive pulmonary disease (COPD) and rarely by α-1 antitrypsin deficiency, produces a state of abnormal lung hyperinflation and has been shown to be strongly associated with a vertical frontal P-wave axis. A vertical P-wave axis (>60°) during sinus rhythm can be easily determined by a simple glance at the electrocardiogram: an entirely inverted or dominantly negative P wave in lead aVL and, alternatively, a P wave in lead III larger than the P wave in lead I ( Figure 1 ) . Extent of emphysema can be assessed using computerized tomographic (CT) densitometric parameters (mainly using percent total lung area occupied by relative low-attenuation regions consisting of a pixel density of ≤−950 HU) on segmented CT image data. Our study primarily aimed to investigate the correlation between the electrocardiographic P-wave axis and CT emphysema quantification in patients with COPD/emphysema. In addition, we studied the interrelation among various electrocardiographic factors, different morphologic types of emphysema, and pulmonary function tests.
Methods
Twenty-three patients with a known diagnosis of COPD/emphysema were investigated. Inclusion criteria were age >45 years, normal sinus rhythm, availability of a full-inspiration noncontrast high-resolution CT scan (done using a standard construction algorithm with 10-mm slices), and pulmonary function tests. Patients <45 years old were excluded because a vertical P-wave axis is a normal finding in healthy children and many young adults. Any electrocardiographic rhythm other than sinus was excluded. Extent of emphysema was quantified by an expert radiologist using the percent total lung area occupied by pixels with attenuation value ≤−950 HU (i.e., relative low-attenuation area) on segmented CT image data with help of semi-automated quantification software. Type of emphysema was classified by the predominance of lobar involvement: predominantly upper lobe, predominantly lower lobe, and diffuse/non-predominant lobar emphysema. Based on CT appearance, emphysema was also characterized as centriacinar (low-attenuation area surrounded by normal attenuation) and panacinar (generalized decrease in attenuation). Electrocardiograms were then reviewed to determine the P-wave axis in customary fashion. Other electrocardiographic factors characteristic of emphysema, namely R-wave amplitude in lead V 6 and P-wave amplitude in lead aVF, were also recorded. The radiologist and electrocardiographic reviewers were mutually blinded. P vector, R-wave amplitude in lead V 6 , and P-wave amplitude in lead aVF were directly compared to the radiographic percent emphysematous area (RPEA) to determine the statistical correlation. Degree of the P-vector (DOPV), RPEA, and forced expiratory volume at 1 second (FEV1) were also compared in relation to types of emphysema to determine the statistical correlation. Statistical analysis was done using SPSS 15.0 for Windows (SPSS, Inc., Chicago, Illinois). Pearson correlation test was used for bivariate analysis of quantitative variables. A p value <0.05 was considered statistically significant. The study was performed in accordance with the ethical standards laid down in an appropriate version of the 2000 Declaration of Helsinki.
Results
Mean age ± SD of study population was 68.39 ± 9.89 years (n = 23) and 10 were men (43%). All patients had a vertical P-wave axis (>60°). The mean ± SD value of the P-wave axis was 73 ± 10°. Mean ± SD values of R-wave amplitude in lead V 6 and P-wave amplitude in lead aVF were 8.1 ± 2.2 and 1.78 ± 0.53 mm, respectively. Based on lobar involvement 11 patients (47.8%) were found to have predominantly lower lobe emphysema, 8 (38%) had predominantly upper lobe emphysema, 1 (4.8%) had predominantly central emphysema, and 3 (13.2%) had non-predominant lobar/mixed emphysema. Based on CT characterization of acinar involvement, 12 patients (52.2%) had panacinar emphysema (most commonly involving basal lung segments) and 11 (47.8%) had centriacinar emphysema (most commonly involving the upper and central lung segments). DOPV had an overall significant positive correlation with RPEA in all patients but the correlation was very strong in patients with predominantly lower lobe emphysema. DOPV and RPEA had no significant correlation in predominantly upper lobe emphysema and non-predominant lobar emphysema ( Figure 2 ) . Similarly, the P-wave axis and RPEA had an overall significant inverse correlation with FEV1 but the correlation was very strong in patients with lower lobe emphysema and thus strongly correlated with severity of obstructive lung disease. Bivariate correlation analysis in different lobar emphysema types are presented in Table 1 . R-wave amplitude in lead V 6 had a significant inverse correlation to RPEA in patients with lower lobe emphysema ( Figure 2 ). P-wave amplitude in lead aVF and RPEA had a weak nonsignificant correlation in all patients with emphysema (r = +0.34, p = 0.1). Correlation analysis of the electrocardiographic P-wave axis with CT emphysema quantification and pulmonary function (FEV1) in relation to the structural classification of emphysema (panacinar and centriacinar) was also determined ( Table 2 ).
| Emphysema (predominant lobe) | Bivariate Correlation | Correlation Coefficient | p Value (2-tailed) |
|---|---|---|---|
| Central (n = 1) | P-wave axis and RPEA | — | — |
| RPEA and FEV1 | — | — | |
| P-wave axis and FEV1 | — | — | |
| RV6 and RPEA | — | — | |
| Lower (n = 11) | P-wave axis and RPEA | +0.89 | 0.0002 |
| RPEA and FEV1 | −0.97 | <0.0001 | |
| P-wave axis and FEV1 | −0.92 | <0.0001 | |
| RV6 and RPEA | −0.76 | 0.006 | |
| Upper (n = 8) | P-wave axis and RPEA | +0.41 | 0.32 |
| RPEA and FEV1 | −0.54 | 0.17 | |
| P-wave axis and FEV1 | −0.84 | 0.009 | |
| RV6 and RPEA | −0.39 | 0.35 | |
| Nonpredominant/mixed (n = 3) | P-wave axis and RPEA | −0.59 | 0.6 |
| RPEA and FEV1 | −0.89 | 0.3 | |
| P-wave axis and FEV1 | 0.16 | 0.9 | |
| RV6 and RPEA | 0.66 | 0.54 | |
| Overall (n = 23) | P-wave axis and RPEA | 0.77 | <0.0001 |
| RPEA and FEV1 | −0.62 | 0.002 | |
| P-wave axis and FEV1 | −0.7 | 0.0002 | |
| RV6 and RPEA | −0.39 | 0.06 |
Stay updated, free articles. Join our Telegram channel

Full access? Get Clinical Tree


