Patients with atrial fibrillation, who are referred for radiofrequency pulmonary vein antral isolation, frequently undergo transesophageal echocardiography (TEE) to detect and/or exclude left atrial or left atrial appendage (LAA) thrombus and cardiac computed tomographic angiography (CCTA) to define and/or evaluate left atrial and pulmonary venous anatomy. Previous studies have reported CCTA to have high sensitivity and negative predictive value (NPV) for detecting thrombus in the LAA. Previous studies determining an optimal LAA/ascending aorta (AA) Hounsfield unit (HU) density ratio for detection of LAA thrombus have been small, with limited numbers of thrombi. We thus sought to determine both the optimal cutoff for LAA HU density and LAA/AA HU density ratio in detecting LAA thrombus compared with TEE in a multicenter population. We included 84 patients who had undergone CCTA and TEE. LAA was evaluated by 64-row CCTA qualitatively (visual filling defect) and quantitatively (measurement of LAA HU density and LAA/AA HU density ratio), using a 1-cm area of interest in the same axial plane. Results were compared with TEE visualization of thrombus or spontaneous echo contrast. Qualitative identification of thrombus in LAA by CCTA compared with TEE detection of thrombus had a sensitivity of 100%, a specificity of 77.9%, a positive predictive value (PPV) of 51.6%, an NPV of 100%, and a total accuracy of 82.1%. The optimal LAA HU density cutoff for thrombus detection was 119 with a sensitivity of 88%, a specificity of 86%, PPV 56%, and an area under the curve of 0.923 (p = 0.0004). The optimal LAA/aorta HU ratio was 0.242 with a sensitivity of 87%, a specificity of 88%, a PPV of 64%, and an area under the curve of 0.921 (p = 0.0011). There is no significant difference (p = 0.72) between both areas under the curve, and both measurements improved the specificity and PPV compared with qualitative measures. Multidetector computed tomography is an imaging technique that can exclude LAA thrombus with very high NPV. Quantitative measurement of LAA HU density (cutoff 119) or LAA/aorta HU density ratio (cutoff 0.242) improves accuracy of positively detecting LAA thrombus. This technique is especially useful when delayed scanning is not performed and LAA is found incidentally after the patient scanning is complete.
Atrial fibrillation (AF) is a relatively common arrhythmia that is more prevalent in men and with increasing age. AF can have adverse consequences related to a reduction in cardiac output and atrial and atrial appendage thrombus formation that can lead to systemic embolization. Three conditions need to be present for the development of thrombosis namely, abnormalities in blood flow, abnormalities in blood vessel wall, and interaction with blood constituents. In patients with AF, clinical features that are commonly associated with stroke and thromboembolism include dilated atria, poorly contracting dilated left ventricle, valvular heart disease (particularly mitral stenosis), and congestive heart failure. AF may also confer a hypercoagulable or prothrombotic state. A dilated left atrium (LA) and reduced LA and left atrial appendage (LAA) blood flow on echocardiogram are independent risk factors for thromboembolism and are more likely to have stasis of blood as demonstrated by the presence of spontaneous echo contrast (SEC) or “smoke” on transesophageal echocardiography (TEE). SEC has been related to hemodynamic and hemostatic abnormalities and an increased risk of stroke and thromboembolism.
Nearly all patients with their first episode of AF will benefit from transthoracic echocardiographic evaluation to identify a LA thrombus, although sensitivity is low. TEE is much more sensitive for identifying LA thrombi. Pulmonary vein antral isolation (PVAI) has been shown to be successful in eliminating or reducing the frequency of recurrent AF in >60% of patients and is now one of the accepted treatment methods for AF. Although TEE is the gold standard for detecting LA thrombus, there has been increasing interest in the use of cardiac computed tomography angiography (CCTA), especially with its 3-dimensional imaging ability and high spatial, temporal, and contrast resolutions. Patients who are scheduled for PVAI routinely undergo both TEE for exclusion of thrombus and CCTA to define pulmonary venous anatomy. CCTA may also demonstrate filling defects in the LA or LAA, which may represent thrombus or incomplete mixing of computed tomographic contrast and blood. Previous studies have reported CCTA to have high sensitivity and negative predictive value (NPV) for detecting thrombus in LAA. We thus sought to determine (1) the accuracy of CCTA in detecting and excluding LAA thrombus and (2) determine the optimal cutoff for LAA Hounsfield unit (HU) density and LAA/ascending aorta (AA) HU density ratio in detecting LAA thrombus compared with TEE as the gold standard.
Methods
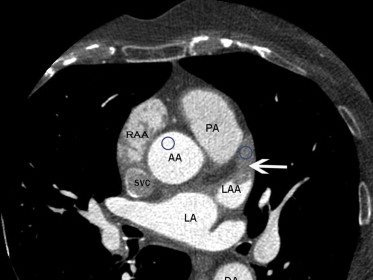
We retrospectively reviewed studies of 84 consecutive patients who had both TEE and CCTA performed at a mean average interval of 24 days between both the studies. The patients had studies done as part of the initial clinical workup before PVAI procedure for treatment of paroxysmal or persistent AF. Exclusion criteria were weight >227 kg (scanner table limit), renal insufficiency (glomerular filtration rate <30 ml/min), and a documented history of anaphylaxis to iodinated contrast agent. Images were obtained at 2 separate institutions, 1 private practice and 1 academic institution. TEE studies were analyzed by a reader blinded to CCTA, and CCTA images from both sites were analyzed by 1 experienced reader blinded to all clinical and echocardiographic information. LAA was evaluated by CCTA with visual assessment for a filling defect, which was defined as an area of low attenuation (dark) that persists in a delayed scan (40-second delay, second scan without contrast administration). We then proceeded to a quantitative assessment by measurement of mean HU density in a 1-cm area of interest in the LAA and AA in the same axial plane to give an LAA/AA HU ratio ( Figure 1 ).
CCTA was performed at both sites, using a General Electric Lightspeed Volume CT (VCT) (Milwaukee, Wisconsin) 64-slice scanner with similar protocols. The study is done in 3 phases: first phase is patient management, which includes heart rate control, pacemaker rate modification, obtaining history of contrast or dye allergies, medication review, and assessment of renal function (creatinine or glomerular filtration rate) to determine what contrast agent to use and also determine if there is need for premedication. Second phase is assessing the flow rate (circulation time), which is the time it takes blood to transit from the access vein to the target area. Our protocol uses 10 to15 ml of contrast media injected at a rate of 5 ml/s to calculate the circulation time, which is measured after bolus injection with serial scanning of the same slice to obtain the peak enhancement time through time-density curve analysis (gamma variate curve). The final phase is the acquisition of the data, which is done using the circulation time obtained from the time-density curve analysis. Total injection volume ranges from 40 to 80 ml. All patients had a delayed CCTA scan at 40 seconds, without additional contrast, to improve the detection of true thrombus by eliminating areas of incomplete mixing of blood and contrast in LAA.
Informed consent was obtained from all patients. Intravenous sedation (propofol) was then administered to each patient. TEE was performed by an experienced echocardiographer using a commercially available 5.0-MHz, 128-element, phased-array probe, multiplane TEE transducer (model MPT 7-4; Phillips, Bothell, Washington). Examinations of the LA and the LAA were performed in multiple planes. In most patients, assessment for the presence of an intracardiac shunt was also performed by contrast study with agitated saline solution.
The TEE report included visual identification of the presence or absence of the following markers of increased risk for systemic thromboembolism: presence of an intracavitary thrombus within the LA or LAA; echocardiographic indicators of varying degrees of blood stasis, ranging from SEC to “sludge,” the latter being a viscid echo density in the LA or LAA without clear thrombus formation; and assessment of mechanical function of the LAA, with a low LAA emptying velocity defined as <20 cm/s.
Results
In our study of 84 patients, the mean age of patients was 64 years; 81% men and 19% women. TEE demonstrated LAA thrombus in 16 patients and no thrombus in 68 patients. By CCTA, 31 studies demonstrated a visual filling defect in LAA and 53 studies had no filling defect suggestive of thrombus. Based on this, the qualitative (visual assessment) detection of LAA thrombus by CCTA has a sensitivity of 100%, a specificity of 77.9%, a positive predictive value (PPV) of 51.6%, an NPV of 100%, and a total accuracy of 82.1%. Figure 2 shows an example of filling defect on CCTA and TEE for the same patient. Using the receiver operating characteristic curve analysis ( Figure 3 ), we assessed the performance of different cut-off points for both measured HU density in LAA and also the ratio of LAA/AA HU density. The optimal LAA HU density cutoff for thrombus detection was 119. At this cutoff, sensitivity was 88%, specificity 86% (improved), PPV 56%, and area under curve 0.924 (p = 0.0004). The optimal LAA/AA HU density ratio was 0.242 with sensitivity 87%, specificity 88% (improved), PPV 64%, and area under curve 0.921 (p = 0.0011). There is no significant difference (p = 0.72) between both areas under the curve for LAA HU and LAA/AA HU ratio, suggesting that LAA HU and LAA/AA HU ratio measurements have similar accuracy in detecting LAA thrombus. In comparison, using a different cutoff for LAA HU of 77 has a sensitivity of 76%, a specificity of 90%, and a PPV of 63% and LAA/AA HU of 0.728 has a sensitivity of 100%, a specificity of 70%, and a PPV of 52%. This suggests that the lower the LAA HU and LAA/AA HU ratio, the greater the specificity and PPV for thrombus detection by CCTA.
Stay updated, free articles. Join our Telegram channel

Full access? Get Clinical Tree


