Left ventricular (LV) dysfunction and multivessel disease (MVD) have been associated with greater mortality after ST-segment elevation myocardial infarction. The aim of this study was to evaluate the impact of LV dysfunction and MVD in patients with ST-segment elevation myocardial infarctions treated with primary percutaneous coronary intervention (PCI). Patients from the Harmonizing Outcomes With Revascularization and Stents in Acute Myocardial Infarction (HORIZONS-AMI) trial treated with primary PCI in whom baseline LV function was assessed using left ventriculography were included in this study. Early and late (3-year) outcomes were examined in groups of patients with reduced (<40%) and preserved (≥40%) LV ejection fractions (LVEFs), further stratified by the presence of MVD. A total of 2,430 patients were included. Patients with reduced LVEFs were older; were more likely to be women; were more likely to have histories of myocardial infarction, PCI, and heart failure; and were more likely to present in heart failure. Patients with reduced LVEFs had greater 30-day (8.9% vs 0.9%, hazard ratio 9.81, 95% confidence interval 5.23 to 18.42, p <0.0001) and 3-year (17.1% vs 3.7%, hazard ratio 5.03, 95% confidence interval 3.37 to 7.50, p <0.0001) mortality. Among patients with LVEFs <30% (n = 45), 30% to 40% (n = 157), 40% to 50% (n = 373), 50% to 60% (n = 659), and ≥60% (n = 1,196), 3-year mortality was 29.4%, 13.5%, 6.4%, 3.8%, and 2.9%, respectively (p for trend <0.0001). MVD was associated with greater mortality in patients with preserved but not reduced LVEFs. By multivariate analysis, LV dysfunction was the strongest predictor of 30-day and 3-year mortality. In conclusion, the presence of LV dysfunction as assessed on baseline left ventriculography in patients who undergo primary PCI in the contemporary era is a powerful predictor of early and late mortality, regardless of the extent of coronary artery disease.
Predictors of outcome in patients with ST-segment elevation myocardial infarctions (STEMIs) treated by primary percutaneous coronary intervention (PCI) have been previously examined and reported. However, most of these studies were from the early era of primary PCI. In these earlier reports, reduced left ventricular (LV) systolic function was described as a major determinant of mortality, as was the presence of multivessel disease (MVD). Whether these factors contribute as strongly to early and late mortality in an era of earlier institution of reperfusion therapy and more effective medical therapies is unknown. We therefore conducted the present study to evaluate the impact of LV systolic dysfunction and the presence of MVD on the early and late outcomes in patients with STEMIs enrolled in the Harmonizing Outcomes With Revascularization and Stents in Acute Myocardial Infarction (HORIZONS-AMI) trial, a large-scale, contemporary international study of patients who undergo primary PCI with contemporary antithrombotic regimens.
Methods
The HORIZONS-AMI trial design has been previously described in detail. In brief, HORIZONS-AMI was a prospective, open-label, 2 × 2 factorial randomized multicenter trial in which patients with STEMIs who underwent primary PCI were randomized in a 1:1 ratio to anticoagulation with unfractionated heparin plus a glycoprotein IIb/IIIa inhibitor or bivalirudin monotherapy (with provisional glycoprotein IIb/IIIa inhibitor use allowed for refractory procedural thrombotic complications). On the basis of emergency coronary arteriography, patients were triaged to PCI (performed in 92.7% of patients), coronary artery bypass grafting (CABG), or medical management. After patency was restored by PCI, eligible patients were randomly assigned again in a 3:1 ratio to paclitaxel-eluting stents (TAXUS Express; Boston Scientific Corporation, Natick, Massachusetts) or identical bare-metal stents (Express; Boston Scientific Corporation).
The performance of left ventriculography was strongly recommended during the index procedure. For the present study, patients treated with primary PCI and who had baseline LV function assessment by ventriculography were included. Patients with significant left main disease (≥50% stenosis) and with previous CABG were excluded from the present analysis. All angiograms were reviewed by an independent core laboratory (Cardiovascular Research Foundation, New York, New York) using quantitative coronary angiography. The LV ejection fraction (LVEF) from the baseline left ventriculogram was measured by the core laboratory. The core laboratory was blinded to cohort assignment and clinical events.
MVD was defined as the presence of ≥1 lesion with diameter stenosis ≥50% in ≥2 major epicardial coronary arteries, as determined by the angiographic core laboratory, and further subclassified as double- or triple-vessel disease. Clinical end points for the present analysis included all-cause mortality, cardiac mortality, major adverse clinical events (MACEs; the composite of death, reinfarction, target vessel revascularization for ischemia, or stroke), non-CABG-related major bleeding, and net adverse clinical events (the composite of MACEs or non-CABG-related major bleeding), at 30-day and 3-year follow-up. An independent clinical events committee blinded to treatment assignment adjudicated all principal end point and stent thrombosis events using original source documents.
Outcomes were examined in groups of patients with reduced (<40%) and preserved (≥40%) LVEFs. The cut-off point of 40% was chosen on the basis of the definition used in most trials to define patients with LV systolic dysfunction. Outcomes of patients with single-vessel disease and MVD were examined in subgroups of patients with preserved and reduced LV function. Further analyses of patients with single-vessel versus double-vessel versus triple-vessel disease were also performed.
Categorical variables are presented as percentages and were compared using chi-square tests or Fisher’s exact tests. Continuous variables are presented as medians with interquartile ranges and were compared using Mann-Whitney U tests. The primary event analyses were performed with the use of time-to-event data (with data censored at the time of a patient’s withdrawal from the study or at the time of last follow-up). Cumulative event rates were calculated according to the Kaplan-Meier method and compared using the log-rank test. Landmark survival analysis was performed to examine the impact of LV dysfunction and MVD on early (0- to 30-day) and late (30-day to 3-year) clinical outcomes. Multivariate Cox proportional-hazards regression was performed to identify independent predictors of 30-day and 3-year mortality including reduced LVEF as the primary covariate of interest. The following patient-level candidate predictors were included in the models: age, gender, Killip class II to IV, diabetes, hypertension, hyperlipidemia, previous myocardial infarction, left anterior descending coronary artery disease, randomization to bivalirudin versus heparin plus a glycoprotein IIb/IIIa inhibitor, symptom-to-balloon time, clopidogrel loading dose of 600 mg versus <600 mg, prerandomization heparin, and creatinine clearance <60 ml/min. All statistical analyses were performed using SAS version 9.2 (SAS Institute Inc., Cary, North Carolina). A p value <0.05 was considered statistically significant, and all p values are 2 sided.
Results
Of 3,602 randomized patients, primary PCI was performed in 3,340 (92.7%), among whom left ventriculography was performed in 2,673 (80.0%). Two hundred forty-three patients (9.1%) had previous CABG or left main stenosis ≥50% by quantitative coronary angiography or left main PCI and were excluded from the analysis. Therefore, the study cohort consisted of 2,430 patients.
Baseline characteristics are listed in Table 1 . Patients with LVEFs <40% compared to those with LVEFs ≥40% were older; were more likely to be women; and were more likely to have histories of myocardial infarction, PCI, or congestive heart failure. Patients with reduced LVEFs were also more likely to have baseline renal dysfunction and to present with more advanced Killip class. The infarct-related artery in patients with reduced LVEFs was more likely to be the left anterior descending coronary artery, and postprocedural Thrombolysis In Myocardial Infarction (TIMI) grade 3 flow was less frequently achieved in these patients ( Table 2 ). Patients with baseline reduced LVEFs were also more likely to be discharged on warfarin and diuretics and were less likely to be sent home on β blockers ( Table 3 ).
| Clinical characteristic | LVEF <40% (n = 202) | LVEF ≥40% (n = 2,228) | HR (95% CI) | p Value |
|---|---|---|---|---|
| Age (yrs) | 60.3 (54.6–72.3) | 59.2 (52.2–68.7) | NA | 0.04 |
| Women | 30.7% (62/202) | 22.2% (495/2,228) | 1.38 (1.11–1.72) | 0.006 |
| Body mass index (kg/m 2 ) | 26.6 (24.2–29.5) | 27.1 (24.6–30.0) | NA | 0.11 |
| Hypertension | 52.7% (106/201) | 51.7% (1152/2,228) | 1.02 (0.89–1.17) | 0.78 |
| Hyperlipidemia | 38.3% (77/201) | 40.5% (902/2,228) | 0.95 (0.79–1.14) | 0.55 |
| Current smokers | 47.5% (95/200) | 49.0% (1089/2,221) | 0.97 (0.83–1.13) | 0.68 |
| Diabetes mellitus | 18.9% (38/201) | 15.2% (339/2,228) | 1.24 (0.92–1.68) | 0.17 |
| Insulin treated | 7.0% (14/201) | 4.2% (94/2,228) | 1.65 (0.96–2.84) | 0.07 |
| Previous myocardial infarction | 12.9% (26/201) | 8.8% (195/2,228) | 1.48 (1.01–2.17) | 0.048 |
| Previous PCI | 12.4% (25/201) | 8.0% (178/2,228) | 1.56 (1.05–2.31) | 0.029 |
| Heart failure | 7.0% (14/201) | 1.6% (36/2,228) | 4.31 (2.37–7.86) | <0.0001 |
| Creatinine clearance <60 ml/min | 20.1% (37/184) | 14.5% (301/2,073) | 1.38 (1.02–1.88) | 0.04 |
| Killip class | ||||
| I | 82.1% (165/201) | 93.0% (2070/2,226) | 0.88 (0.83–0.94) | <0.0001 |
| II | 12.9% (26/201) | 5.9% (132/2,226) | 2.18 (1.47–3.24) | 0.0001 |
| III | 2.5% (5/201) | 0.6% (13/2,226) | 4.26 (1.53–11.83) | 0.01 |
| IV | 2.5% (5/201) | 0.5% (11/2,226) | 5.03 (1.77–14.35) | 0.008 |
| Characteristic | LVEF <40% (n = 202) | LVEF ≥40% (n = 2,228) | HR (95% CI) | p Value |
|---|---|---|---|---|
| Angiographic characteristics | ||||
| Index vessel | ||||
| Left anterior descending coronary artery | 67.9% (152/224) | 38.0% (904/2,379) | 1.79 (1.61–1.98) | <0.0001 |
| Left circumflex coronary artery | 12.5% (28/224) | 16.6% (396/2,379) | 0.75 (0.52–1.07) | 0.11 |
| Right coronary artery | 19.6% (44/224) | 45.3% (1078/2,379) | 0.43 (0.33–0.57) | <0.0001 |
| TIMI flow grade before PCI | ||||
| 0 or 1 | 70.0% (156/223) | 64.1% (1522/2,375) | 1.09 (1.00–1.20) | 0.08 |
| 2 | 15.2% (34/223) | 16.5% (392/2,375) | 0.92 (0.67–1.28) | 0.63 |
| 3 | 14.8% (33/223) | 19.4% (461/2,375) | 0.76 (0.55–1.06) | 0.09 |
| TIMI flow grade after PCI | ||||
| 0 or 1 | 2.2% (5/223) | 1.7% (40/2,375) | 1.33 (0.53–3.34) | 0.59 |
| 2 | 9.9% (22/223) | 4.7% (111/2,375) | 2.11 (1.36–3.27) | 0.0008 |
| 3 | 87.9% (196/223) | 93.6% (2224/2,375) | 0.94 (0.89–0.99) | 0.001 |
| Thrombus present | 72.2% (179/248) | 70.1% (1874/2,672) | 1.03 (0.95–1.12) | 0.50 |
| Tortuosity: moderate/severe | 0.8% (2/248) | 1.3% (36/2,671) | 0.60 (0.14–2.47) | 0.77 |
| Calcification: moderate/severe | 34.3% (85/248) | 35.5% (947/2,666) | 0.96 (0.81–1.15) | 0.69 |
| Lesion type ∗ | ||||
| A | 0.8% (2/248) | 3.9% (105/2,674) | 0.21 (0.05–0.83) | 0.01 |
| B1 | 10.9% (27/248) | 10.6% (283/2,674) | 1.03 (0.71–1.49) | 0.88 |
| B2 | 11.3% (28/248) | 12.2% (327/2,674) | 0.92 (0.64–1.33) | 0.67 |
| C | 77.0% (191/248) | 73.3% (1959/2,674) | 1.05 (0.98–1.13) | 0.20 |
| Procedural characteristics | ||||
| Randomized to bivalirudin | 48.0% (97/202) | 49.9% (1111/2,228) | 0.96 (0.83–1.12) | 0.62 |
| Randomized to bare-metal stent | 22.2% (41/185) | 25.2% (521/2,064) | 0.88 (0.66–1.16) | 0.35 |
| Any glycoprotein IIb/IIIa inhibitor | 58.5% (117/200) | 55.5% (1235/2,225) | 1.05 (0.93–1.19) | 0.41 |
| Stents implanted | 95.5% (193/202) | 95.0% (2117/2,228) | 1.01 (0.97–1.04) | 0.74 |
| Number of stents | 1.6 ± 1.0 | 1.5 ± 0.8 | NA | 0.13 |
| Total stent length (mm) | 24.0 (20.0–36.0) | 24.0 (20.0–36.0) | NA | 0.87 |
| Multivessel treated | 6.5% (13/199) | 3.8% (84/2,191) | 1.70 (0.97–3.00) | 0.06 |
| Symptom onset to balloon (minutes) | 256 (170–358) | 221 (161–335) | NA | 0.08 |
| Medication | LVEF <40% (n = 202) | LVEF ≥40% (n = 2,228) | HR (95% CI) | p Value |
|---|---|---|---|---|
| Aspirin | 97.3% (178/183) | 98.9% (2183/2,208) | 0.98 (0.96–1.01) | 0.07 |
| Thienopyridine | 99.5% (182/183) | 98.5% (2176/2,209) | 1.01 (1.00–1.02) | 0.51 |
| Warfarin | 9.8% (18/183) | 2.9% (65/2,210) | 3.34 (2.03–5.51) | <0.0001 |
| β blockers | 87.4% (174/199) | 91.7% (2037/2,222) | 0.95 (0.90–1.01) | 0.042 |
| ACE inhibitors | 83.6% (153/183) | 77.9% (1722/2,210) | 1.07 (1.00–1.15) | 0.07 |
| ARBs | 4.9% (9/183) | 6.7% (149/2,210) | 0.73 (0.38–1.41) | 0.34 |
| ACE inhibitors or ARBs | 87.4% (160/183) | 83.1% (1837/2,210) | 1.05 (0.99–1.11) | 0.13 |
| Diuretics | 39.3% (72/183) | 18.9% (418/2,210) | 2.08 (1.70–2.54) | <0.0001 |
| Statins | 95.1% (174/183) | 96.2% (2125/2,210) | 0.99 (0.96–1.02) | 0.47 |
| Digoxin | 1.6% (3/183) | 1.1% (24/2,210) | 1.51 (0.46–4.97) | 0.46 |
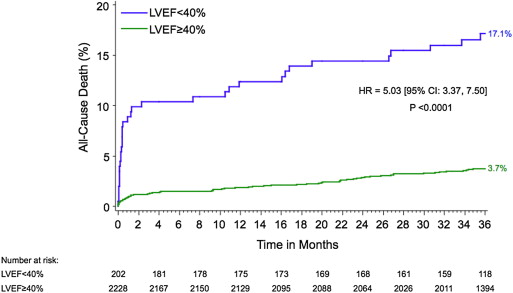
Patients with LVEFs <40% had significantly worse early (30-day) and late (3-year) outcomes compared to those with LVEFs ≥40% ( Table 4 ). Thirty-day and 3-year mortality was significantly increased for patients with LV dysfunction ( Figure 1 ). Among patients with LVEFs <30% (n = 45), 30% to 40% (n = 157), 40% to 50% (n = 373), 50% to 60% (n = 659), and ≥60% (n = 1,196), 30-day mortality was 8.9%, 8.9%, 0.5%, 0.9%, and 1.1%, respectively, and 3-year mortality was 29.4%, 13.5%, 6.4%, 3.8%, and 2.9%, respectively (p for trend <0.0001 for both). Patients with LV dysfunction also had greater rates of net adverse clinical events, MACEs, and major bleeding. No significant differences in the rates of stroke, reinfarction, or target vessel revascularization were observed according to LVEF. However, patients with reduced LV systolic function were more likely to undergo CABG at 1 year (3.3% vs 1.0%, hazard ratio 3.28, 95% confidence interval 1.32 to 8.03, p = 0.007) and 3 years (4.5% vs 1.7%, hazard ratio 2.71, 95% confidence interval 1.26 to 5.83, p = 0.008).
| Outcome | LVEF <40% (n = 202) | LVEF ≥40% (n = 2,228) | HR (95% CI) | p Value |
|---|---|---|---|---|
| 30-day outcomes | ||||
| Death | 8.9% (18) | 0.9% (21) | 9.81 (5.23–18.42) | <0.0001 |
| Cardiac | 8.4% (17) | 0.8% (17) | 11.41 (5.83–22.35) | <0.0001 |
| Noncardiac | 0.5% (1) | 0.2% (4) | 2.92 (0.33–26.17) | 0.31 |
| MACEs ∗ | 12.9% (26) | 3.3% (74) | 4.02 (2.57–6.29) | <0.0001 |
| NACEs † | 20.8% (42) | 8.6% (192) | 2.55 (1.83–3.56) | <0.0001 |
| Reinfarction | 3.2% (6) | 1.5% (34) | 2.02 (0.85–4.80) | 0.11 |
| Stroke | 0.5% (1) | 0.5% (10) | 1.14 (0.15–8.94) | 0.90 |
| All revascularization | 4.6% (9) | 3.0% (66) | 1.56 (0.78–3.13) | 0.21 |
| CABG | 0.5% (1) | 0.2% (5) | 2.24 (0.26–19.14) | 0.45 |
| Major bleeding (non-CABG) | 13.6% (27) | 6.4% (141) | 2.23 (1.48–3.36) | <0.0001 |
| 3-year outcomes | ||||
| Death | 17.1% (34) | 3.7% (81) | 5.03 (3.37–7.50) | <0.0001 |
| Cardiac | 12.6% (25) | 1.8% (39) | 7.55 (4.57–12.48) | <0.0001 |
| Noncardiac | 5.2% (9) | 2.0% (42) | 2.62 (1.27–5.38) | 0.007 |
| MACEs ∗ | 32.0% (64) | 18.8% (408) | 1.94 (1.49–2.52) | <0.0001 |
| NACEs † | 39.5% (79) | 23.3% (508) | 1.96 (1.54–2.48) | <0.0001 |
| Reinfarction | 8.9% (16) | 6.5% (137) | 1.41 (0.84–2.37) | 0.19 |
| Stroke | 2.8% (5) | 1.4% (30) | 2.01 (0.78–5.19) | 0.14 |
| All revascularization | 23.0% (42) | 19.5% (416) | 1.24 (0.90–1.70) | 0.18 |
| CABG | 4.5% (8) | 1.7% (36) | 2.71 (1.26–5.83) | 0.008 |
| Major bleeding (non-CABG) | 16.0% (31) | 7.5% (165) | 2.22 (1.51–3.26) | <0.0001 |
∗ Death, myocardial infarction, ischemic target vessel revascularization, or stroke.
The 3-year mortality rate was 4.1% in patients with single-vessel disease, 6.7% in those with double-vessel disease, and 9.7% in those with triple-vessel disease (p for trend <0.0001). In patients with LVEFs <40%, the presence of MVD did not have a significant impact on short-term and long-term outcomes ( Table 5 , Figure 2 ). However, in patients with LVEFs ≥40%, 30-day and 3-year mortality rates were significantly greater in patients with MVD compared to single-vessel disease. The 3-year rates of net adverse clinical events, MACEs, stroke, and revascularization were also increased in patients with preserved LV function and MVD compared to single-vessel disease, but not in those with reduced LV function ( Table 5 ). No significant difference in mortality was seen between patients with double- and triple-vessel disease ( Figure 3 ).
| Outcome | LVEF <40% | LVEF ≥40% | ||||||
|---|---|---|---|---|---|---|---|---|
| MVD (n = 124) | SVD (n = 78) | HR (95% CI) | p Value | MVD (n = 1,219) | SVD (n = 1,000) | HR (95% CI) | p Value | |
| 30-day outcomes | ||||||||
| Death | 8.9% (11) | 9.0% (7) | 0.99 (0.38–2.56) | 0.98 | 1.5% (18) | 0.3% (3) | 5.00 (1.45–16.67) | 0.004 |
| Cardiac | 8.1% (10) | 9.0% (7) | 0.90 (0.34–2.38) | 0.83 | 1.2% (15) | 0.2% (2) | 6.25 (1.41–25.00) | 0.006 |
| Noncardiac | 0.9% (1) | 0.0% (0) | NA | 0.44 | 0.2% (3) | 0.1% (1) | 2.50 (0.26–25.00) | 0.42 |
| MACEs ∗ | 11.3% (14) | 15.4% (12) | 0.72 (0.33–1.56) | 0.40 | 3.9% (47) | 2.7% (27) | 1.43 (0.89–2.33) | 0.13 |
| NACEs † | 19.4% (24) | 23.1% (18) | 0.83 (0.45–1.54) | 0.56 | 9.0% (109) | 8.3% (83) | 1.08 (0.81–1.43) | 0.61 |
| Reinfarction | 2.6% (3) | 4.0% (3) | 0.63 (0.13–3.13) | 0.56 | 1.6% (19) | 1.5% (15) | 1.04 (0.53–2.04) | 0.90 |
| Stroke | 0.8% (1) | 0.0% (0) | NA | 0.43 | 0.5% (6) | 0.4% (4) | 1.23 (0.35–4.35) | 0.74 |
| All revascularization | 3.4% (4) | 6.7% (5) | 0.49 (0.13–1.85) | 0.28 | 3.4% (41) | 2.4% (24) | 1.41 (0.85–2.33) | 0.17 |
| CABG | 0% (0) | 1.4% (1) | NA | 0.21 | 0.2% (3) | 0.2% (2) | 1.23 (0.21–7.14) | 0.82 |
| Major bleeding | 13.1% (16) | 14.3% (11) | 0.93 (0.43–2.00) | 0.83 | 6.2% (75) | 6.6% (66) | 0.93 (0.67–1.30) | 0.68 |
| 3-year outcomes | ||||||||
| Death | 18.0% (22) | 15.7% (12) | 1.18 (0.58–2.38) | 0.66 | 5.2% (61) | 2.0% (20) | 2.50 (1.52–4.17) | 0.0002 |
| Cardiac | 13.2% (16) | 11.6% (9) | 1.14 (0.50–2.56) | 0.77 | 2.5% (29) | 1.0% (10) | 2.38 (1.18–5.00) | 0.01 |
| Noncardiac | 5.6% (6) | 4.6% (3) | 1.30 (0.32–5.26) | 0.71 | 2.8% (32) | 1.0% (10) | 2.63 (1.30–5.26) | 0.005 |
| MACEs ∗ | 32.8% (40) | 30.8% (24) | 1.05 (0.64–1.75) | 0.83 | 22.6% (268) | 14.3% (139) | 1.64 (1.35–2.04) | <0.0001 |
| NACEs † | 38.4% (47) | 41.1% (32) | 0.93 (0.59–1.45) | 0.72 | 26.3% (314) | 19.7% (193) | 1.37 (1.15–1.64) | 0.0005 |
| Reinfarction | 9.0% (10) | 8.5% (6) | 1.08 (0.39–2.94) | 0.89 | 7.4% (85) | 5.3% (51) | 1.39 (0.98–1.96) | 0.06 |
| Stroke | 2.7% (3) | 3.0% (2) | 0.96 (0.16–5.88) | 0.97 | 2.0% (23) | 0.7% (7) | 2.70 (1.18–6.25) | 0.02 |
| All revascularization | 25.2% | 19.6% | 1.32 (0.69–2.50) | 0.41 | 23.7% (276) | 14.4% (138) | 1.75 (1.43–2.17) | <0.0001 |
| CABG | 4.6% (5) | 4.3% (3) | 1.06 (0.25–4.35) | 0.94 | 2.5% (29) | 0.7% (7) | 3.45 (1.52–7.69) | 0.002 |
| Major bleeding | 14.3% (17) | 18.7% (14) | 0.77 (0.38–1.56) | 0.47 | 7.3% (88) | 7.8% (77) | 0.94 (0.69–1.28) | 0.69 |
Stay updated, free articles. Join our Telegram channel

Full access? Get Clinical Tree


