Diminishing yellow color, evaluated by coronary angioscopy, is associated with plaque stabilization and regression. Our aim was to assess the effect of aggressive lipid-lowering therapy with rosuvastatin on plaque regression and instability. Thirty-seven patients with stable angina or silent myocardial ischemia who planned to undergo elective percutaneous coronary intervention and had angioscopic yellow plaques of grade 2 or more were randomized to high-dose (group H, 20 mg/day, n = 18) or low-dose (group L, 2.5 mg/day, n = 19) rosuvastatin therapy for 48 weeks. Yellow plaque was graded on a 4-point scale of 0 (white) to 3 (bright yellow) by angioscopy, and plaque volume was determined by intravascular ultrasound for plaques with a length of 5 to 15 mm. Color and volume were assessed at baseline and after 48 weeks by the investigators blinded to the rosuvastatin dosage, and were compared between the 2 dosing groups. The level of low-density lipoprotein-cholesterol decreased from 130.3 ± 25.5 mg/dl to 61.7 ± 16.5 mg/dl (−50 ± 19%: high intensity) in group H (p <0.001) and from 130.9 ± 28.5 mg/dl to 89.7 ± 29.0 mg/dl (−30 ± 22%: moderate intensity) in group L (mean ± SD, p <0.001). The average color grade of yellow plaques decreased from 2.0 to 1.5 in group H (p <0.001) and from 2.0 to 1.6 in group L (p <0.001) after 48 weeks. Plaque volume decreased significantly in group H but not in group L. The percent change in plaque volume was significantly larger in group H than in group L (p = 0.005). In conclusion, both high-dose and low-dose rosuvastatin increased plaque stability. However, high-dose rosuvastatin was more effective than low-dose rosuvastatin in inducing plaque volume regression.
Clinical Trial Registration No: UMIN-CTR, UMIN000003276.
Aggressive low-density lipoprotein-cholesterol (LDL-C)-lowering therapy with high-intensity statins has been shown to reduce cardiovascular mortality and morbidity. Many multicenter trials have shown that statin therapy can induce plaque volume regression as measured using intravascular ultrasound (IVUS). These reports showed that administration of statin decreased the area of lipid or necrotic components, and that it increased the content of fibrous tissue or the thickness of fibrous caps within coronary atherosclerotic plaques. The principle of the more the better, that is, “the more intense the lipid-lowering, the better the clinical outcome” had been widely accepted. However, the 2013 American College of Cardiology/American Heart Association guideline no longer recommends targeted goals to lower the LDL-C level. Although some previous IVUS studies have clarified the difference in the effect on plaque volume between modest and aggressive lipid-lowering therapies, no studies of plaque instability were examined between these therapies.
Methods
This trial was a prospective, open-label, randomized, investigator-blinded, parallel-comparison study. A total of 56 patients with stable angina or silent myocardial ischemia and dyslipidemia, who satisfied the following criteria, were enrolled: (1) planned to undergo elective percutaneous coronary intervention; (2) dyslipidemia showing a serum LDL-C level ≥ 100 mg/dl; (3) yellow plaque with color intensity of grade 2 or higher; and (4) age between 20 and 75 years. Eligible patients were randomized using a minimization method according to gender, age, and previous use of statin. They were assigned in a 1:1 ratio to either a high-dose group (group H) with a dose of 20 mg/day rosuvastatin or a low-dose group (group L) with a dose of 2.5 mg/day rosuvastatin. The allocation sequence and patient assignment lists were locked away from everyone involved in the assessment of angioscopic and IVUS findings in the core laboratory.
Coronary angiography, angioscopy, and IVUS were performed at weeks 0, 48, and 96. Blood was tested more than 4 weeks before the start of the study, at baseline (week 0), and at weeks 4, 48, and 96 or at the time of withdrawal.
Exclusion criteria were as follows: acute coronary syndrome within 24 hours, emergency percutaneous coronary intervention or coronary artery bypass grafting, familial hypercholesterolemia, hypertriglyceridemia (≥400 mg/dl), poorly controlled diabetes (HbA1c ≥ 8.0%), intolerance or contraindication to statins, liver dysfunction, renal dysfunction (creatinine ≥ 2.0 mg/dl, or creatinine clearance <30 ml/min), and hemodialysis.
The study protocol was approved by the institutional review boards of each institute. Subjects were enrolled after they received a full explanation of the study’s purposes and procedures and provided written consent to participate in the study. The determination of color grade in angioscopy was performed at a core laboratory at the Cardiovascular Institute (Tokyo, Japan) by independent experts who were not involved in the medical care of the patients. IVUS volumetric analysis was performed at a core laboratory at Nihon University by independent experts who were not aware of the patients’ profiles. The data and safety monitoring committee reviewed the conduct of the study to ensure the safety of the participants and to maintain the quality of data collection and management.
Angioscopic observation was performed using a VISIBLE Fiber imaging system (FT-203F; Fiber Tech Co. Ltd., Tokyo, Japan) and console (Intertec Medical Co. Ltd., Osaka, Japan). Immediately after coronary angiography, baseline angioscopic images were obtained using a previously described technique that omitted the use of a proximal occlusion balloon (nonobstructive). The grading of yellow plaque was on a 4-point scale (i.e., 0, white; 1, slightly yellow; 2, yellow; 3, deep yellow) as previously described. The maximum yellow grade at baseline was determined for each patient. The color grade was determined by 2 independent investigators who reviewed all angioscopic images and were completely unaware of the patients’ profiles and the times of image acquisition. If the judgments of reviewers were discordant, plaque color was reevaluated, but if the reevaluations remained discordant, the disagreement was resolved by discussion until consensus was reached. The interobserver reproductivity was 79.2% (186 of 254 plaques) and we reported it previously in the same manner. Based on this capability, we applied the way of diagnosis as earlier.
After intracoronary administration of 100 to 300 μg of nitroglycerin, IVUS imaging was performed with a 2.6Fr 40-MHz Atlantis Pro IVUS catheter and Clear View Imaging System (Boston Scientific Corporation, Natick, MA). The IVUS probe was first advanced as distally as possible, and the images were obtained during automatic pullback at a rate of 0.5 mm/s. The IVUS measurement of the target lesion volume was conducted at baseline and at week 52 using segments 5 to 10 mm long at the lesion site. As in angioscopy, the IVUS protocol excluded plaques at the percutaneous intervention site or <5 mm remote from the site. At the baseline IVUS examination, the analyzed segment included the plaque with the maximum yellow intensity, as determined from simultaneously recorded fluoroscopy and the location of side branches. At IVUS examinations performed at week 48 and 96, the segment of interest was matched with that at baseline using side branches, calcification, or stent edge as landmarks as in the previously reported TWINS study. The boundary of the lumen and external elastic membrane was traced semiautomatically on digitized cross sections of the segment every 0.1 mm using a 3-dimensional analysis system (echoPlaque2, INDEC Systems, Santa Clara, CA). The total atheroma volume (TAV) was calculated by summing the atheroma areas ∑ (external elastic membrane CSA − lumen CSA) for each 0.08-mm segment. The percent change in TAV was calculated using the equation 100 × (TAV [follow-up] − TAV [baseline])/TAV (baseline). An operator who was not involved in the patients’ medical care conducted the IVUS volumetric measurements. On different days, another investigator who was independent of the core laboratory and blinded to the patients’ identities and times of individual image acquisition evaluated the accuracy of the target lesion analysis at baseline and at week 52.
In the multivariate analysis, only one representative plaque with the largest volume and the highest color grade on IVUS was selected.
Primary endpoints were defined that changes in angioscopic yellow grade and changes in TAV and %TAV by IVUS analysis at baseline and at 52 weeks. Each variable of laboratory data was introduced into a multiple regression analysis to identify which factors were independent predictors of plaque stabilization and plaque regression.
The Full Analysis Set was the primary set used for the analysis of efficacy (the primary end point). The sample size was theoretically predetermined on the basis of the changes in the yellow grade of the plaque after aggressive lipid-lowering therapy with high-intensity statin in the previous study.
Continuous data were compared between groups using a 2-sample t test or Wilcoxon rank-sum test, or between baseline and posttreatment using a 1-sample t test or Wilcoxon signed-rank test. Categorical data were compared between groups using the chi-square test or Fisher’s exact test. Each variable was introduced into a stepwise multiple regression model to identify which factors were independent predictors of plaque stabilization and plaque regression. When multiple plaques were registered to one patient, we used nested analysis of covariance for comparison between groups. For the stepwise algorithm, we set p = 0.1 for entry into the model and p = 0.1 to remain in the model, and the respective regression coefficients with 95% confidence intervals were calculated. The p values were 2 sided and the significance level was 5%. SAS system version 9.2 (SAS Institute Inc., Cary, NC) was used for all statistical analyses.
Results
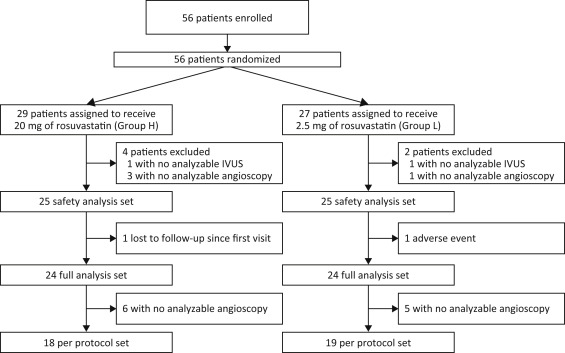
Started in September 2010 in Japan, this study was terminated in April 2013 on the advice of the Independent Data Monitoring Committee after an assessment at week 48. The Committee cited possible disadvantages to group L with continued implementation of the study because the decrease in plaque volume was significantly greater in group H than in group L at week 48. Thus, week 48 was the final time point of study evaluation, and the study data up to week 48 were analyzed. Thus, 25 patients were included in the safety analysis set of each group. There was no adverse event in group H (0%), and 1 withdrew because of an adverse event (unstable angina) in group L (4%); then 1 was lost to follow-up and did not undergo IVUS or angioscopy. In all, 37 patients (group H, n = 18; group L, n = 19) completed the trial ( Figure 1 ). No significant between-group differences in baseline patient characteristics and concomitant medications ( Table 1 ) were observed. Laboratory parameters are listed in Table 2 . The LDL-C level was markedly decreased in both groups; however, the percent changes in the LDL-C level and in the malondialdehyde-modified low-density lipoprotein level were significantly lower in group H.
| Variable | Group H (n=18) | Group L (n=19) | p Value |
|---|---|---|---|
| Male | 13 (72%) | 16 (83%) | 0.440 |
| Age | 65.1±10.1 | 63.8±8.5 | 0.683 |
| Body mass index(kg/m 2 ) | 25.4±3.0 | 25.3±3.5 | 0.909 |
| Smoker | 8 (44%) | 10 (53%) | 0.746 |
| Family history of ischemic heart disease | 5 (28%) | 5 (26%) | 1.000 |
| Hypertension by history | 15 (83%) | 15 (79%) | 1.000 |
| Angina pectoris | 15 (83%) | 15 (79%) | 1.000 |
| Prior Myocardial infarction | 3 (17%) | 4 (21%) | 1.000 |
| Diabetes mellitus | 7 (39%) | 10 (53%) | 0.515 |
| Concomitant medications | |||
| ACE-I or ARB | 5 (28%) | 9 (47%) | 0.313 |
| DPP-4 inhibitor | 2 (11%) | 3 (16%) | 1.000 |
| Insulin-sensitizing drugs | 0 | 1 (5%) | 1.000 |
| Statins | 8 (44%) | 6 (32%) | 0.508 |
| Variable | Group | Week 0 (Mean±SD) | Week 48 (Mean±SD) | % Change (Week 0 vs Week 48) | High-Dose vs Low-Dose p Value | |
|---|---|---|---|---|---|---|
| Mean±SD | p Value | |||||
| Low density lipoprotein cholesterol (mg/dL) | High-dose | 130.3 ± 25.5 | 61.7 ± 16.5 | -50 ± 19 | <0.001 | 0.006 |
| Low-dose | 130.9 ± 28.5 | 89.7 ± 29 | -30 ± 22 | <0.001 | ||
| High density lipoprotein cholesterol (mg/dL) | High-dose | 45.3 ± 9.7 | 47.7 ± 9.3 | 7 ± 15 | 0.073 | 0.810 |
| Low-dose | 44.6 ± 13 | 47.7 ± 14.4 | 8 ± 22 | 0.129 | ||
| Triglyceride (mg/dL) | High-dose | 132.5 ± 56.4 | 111.4 ± 53.4 | -11 ± 33 | 0.181 | 0.299 |
| Low-dose | 138.9 ± 95.2 | 120.8 ± 54.6 | 12 ± 85 | 0.555 | ||
| Malondialdehyde modified low density lipoprotein cholesterol (U/L) | High-dose | 193.1 ± 54.2 | 95.4 ± 20 | -44 ± 31 | <0.001 | 0.008 |
| Low-dose | 170.3 ± 59.5 | 133.7 ± 39.3 | -16 ± 29 | 0.024 | ||
| Serum-Creatinine (mg/dL) | High-dose | 0.822 ± 0.22 | 0.796 ± 0.22 | -3 ± 11 | 0.196 | 0.338 |
| Low-dose | 0.785 ± 0.267 | 0.769 ± 0.18 | 1 ± 17 | 0.771 | ||
| Estimated glomerular filtration rate (mL/min/1.73m 2 ) | High-dose | 70.72 ± 13.95 | 74.78 ± 20.7 | 5 ± 16 | 0.168 | 0.471 |
| Low-dose | 79.88 ± 19.88 | 79.08 ± 17.6 | 1 ± 17 | 0.711 | ||
| High-sensitivity C-reactive protein (mg/L) | High-dose | 0.200 ± 0.163 | 0.07 ± 0.1 | -51 ± 72 | 0.008 | 0.211 |
| Low-dose | 0.225 ± 0.196 | 0.09 ± 0.12 | 15 ± 210 | 0.755 | ||
| Glycosylated hemoglobin A1C(%) | High-dose | 6.31 ± 1.29 | 6.07 ± 0.79 | -2 ± 10 | 0.388 | 0.683 |
| Low-dose | 6.23 ± 0.79 | 6.15 ± 0.75 | -1 ± 6 | 0.453 | ||
| Low density lipoprotein cholesterol / High density lipoprotein cholesterol | High-dose | 2.98 ± 0.81 | 1.37 ± 0.53 | -0.5 ± 0.2 | <0.001 | 0.016 |
| Low-dose | 3.12 ± 0.91 | 2.05 ± 0.91 | -0.3 ± 0.3 | <0.001 | ||
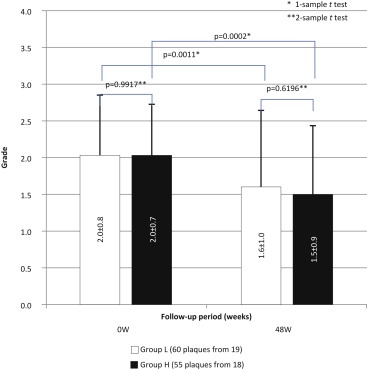
The mean yellow color grade (2.0 ± 0.7 at baseline and 1.5 ± 0.9 at week 48 for group H, 2.0 ± 0.8 at baseline and 1.6 ± 1.0 at week 48 for group L; Figure 2 ) but not the percent change in grade (−21.5% in group H and −16.4% in group L; Figure 3 ) differed significantly between the 2 groups. Multivariate analysis ( Table 3 ) of the relation between changes in angioscopically determined color grade and patients’ characteristics (including serum biomarkers at baseline) identified history of previous treatment with statin, angina, myocardial infarction, and HbA1c level as significantly independent factors associated with plaque regression resistance.
Stay updated, free articles. Join our Telegram channel

Full access? Get Clinical Tree


