The right ventricular (RV) volume is commonly measured from magnetic resonance images using Simpson’s method from the stack of short-axis images acquired for analysis of the left ventricle. We compared the RV volume measured using Simpson’s method to the RV volume measured using 3-dimensional reconstruction and the piecewise smooth subdivision surface (PSSS) method. We studied 6 normal subjects and 18 patients whose right ventricles carried a systemic pressure load, 1/2 with dexto-transposition of the great arteries repaired with an atrial baffle and 1/2 with levo-transposition of the great arteries. The right ventricle was reconstructed from manually traced borders from the short- and long-axis views using the PSSS method. Simpson’s analysis was performed on short-axis views alone. The RV volumes were smaller when analyzed using Simpson’s method than using the PSSS method. The underestimation averaged 12 ± 19 ml (7 ± 12% of PSSS volume; p <0.001), without a significant difference between the groups. The ejection fraction was similar using both methods in patients with transposition of the great arteries and was overestimated in normal subjects. Image review revealed that the volume underestimation using Simpson’s method was more frequently due to difficulty in interpreting the basal short-axis images than the apical images. In conclusion, to obtain accurate analysis of the short-axis views for RV volume measurement, it would be helpful to incorporate information from additional images, such as the long-axis views, to assist in delineating this chamber’s complex anatomy.
Monitoring the right ventricle is important in caring for patients with congenital heart disease. However, measurement of right ventricular (RV) volume is difficult owing to the right ventricle’s complex shape. The piecewise smooth subdivision surface (PSSS) method is the only method validated for accuracy in reproducing the 3-dimensional (3D) shape of a heart ventricle, as well as for measuring the ventricular volume. The PSSS method uses image data acquired from combinations of views to reconstruct the right ventricle. In contrast, analysis of magnetic resonance images using Simpson’s method is performed from images acquired in parallel planes, usually in the short-axis orientation. The present study was performed to compare volume determination using Simpson’s method from short-axis views and that using full 3D reconstruction of the right ventricle from the long-axis, short-axis, and oblique views.
Methods
We studied 6 normal subjects and 18 patients with congenital heart disease whose right ventricles carried a systemic pressure load to provide ventricles with both normal and abnormal volume and shape. One half of the latter had had dextro-transposition of the great arteries repaired with an atrial baffle and 1/2 had congenitally corrected transposition of the great arteries (levo-transposition of the great arteries). They were selected solely by diagnosis, without regard to the clinical history, and underwent magnetic resonance imaging for clinical indications. The normal subjects were volunteers with a negative cardiac history and normal anatomy on imaging. All study subjects were recruited and underwent imaging as a part of a multicenter project to collect a database of 3D RV reconstructions of patients with congenital heart disease. The subjects were recruited without consideration of age, gender, or ethnicity, had a normal sinus rhythm, and gave informed consent. The Human Subjects Review Committee of the University of Washington approved the study. All data were de-identified in accordance with institutional review board regulations before transfer to the cardiovascular Research and Training Center at the University of Washington for core laboratory analysis.
Magnetic resonance imaging was performed using steady-state free procession cine gradient echo sequences, appropriate for the 1.5 Tesla scanners available at each institution. A total of 8 to 12 consecutive short-axis slices covering both the left and right ventricles were acquired with a 6- to 10-mm slice thickness, depending on patient size. The most basal slice was positioned across the atrioventricular plane at end-diastole. In addition, long axis slices were obtained in a 4-chamber orientation, in radial long-axis views rotating around the left ventricular (LV) long axis and/or in the RV long-axis view to aid in delineating the valves and apex. The use of additional views allowed us to avoid analyzing views in which the endocardial borders were indistinct owing to the partial volume effect. In some studies, oblique views were also acquired for clinical indications ( Figure 1 ).
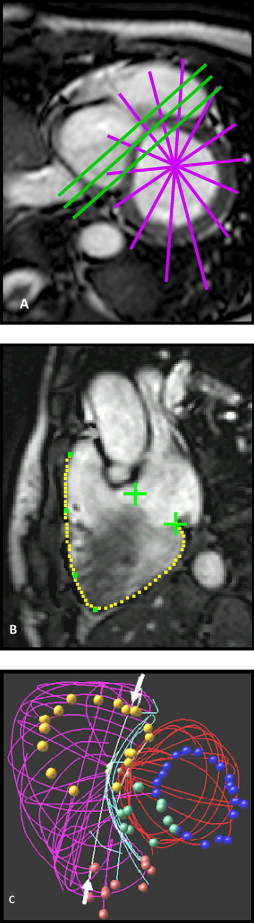
The magnetic resonance imaging data were analyzed using custom software. A key feature of our software interface is the ability to display traced borders in a 3D window, which facilitates review of each traced border with others of the same or other structures. We have found it very important to compare the traced borders with each other to check for consistency of image interpretation and registration. The borders traced from intersecting planes were expected to intersect. If not, both images were inspected, and border editing was performed to resolve the discrepancy, with a greater weight or confidence assigned to the image with the greater endocardial definition in the disputed region, better spatial consistency with adjacent image planes, and/or associated anatomic features that tended to confirm the accuracy of its tracing. This is important in patients with complex congenital heart disease, in whom the underlying anomaly, surgical repair, and/or hemodynamic overload secondary to valve dysfunction can add deformities to the right ventricle’s already complex shape.
End-systole was defined as the most frequently occurring systolic interval and was applied to all cardiac cycles; this method yielded the time of minimum volume. The borders of the right ventricle and valve orifices and other anatomic landmarks were manually traced after review of the cine loop in each view and converted to 3D coordinates using magnetic resonance imaging image plane coordinates. The papillary muscles and trabeculae were included in the chamber volume.
The right ventricle was then reconstructed using the PSSS method and a triangular control mesh that incorporated knowledge of the expected shape of the right ventricle, such as the sharp edges around the valve orifices and along the interface between the free wall and interventricular septum, and the regions of complex shape requiring additional degrees of freedom around the outflow track and along the supraventricular crest. The edges and vertices of this control mesh were labeled to aid in the initial regional correspondence of the anatomic landmarks with the traced data. The control mesh was registered to the traced borders by translation, rotation, and scaling. The control mesh was then subdivided twice, and its vertices were repositioned to minimize the residual distances between the data and the subdivided mesh while satisfying the predetermined smoothness parameters.
The ventricular volume was computed at end-diastole and end-systole as the sum of the signed volumes of the tetrahedra formed by connecting a point in space with each face.
Simpson’s analysis was performed on the same short-axis images as for PSSS analysis. The apical view and views at or basal to the level of the atrioventricular valve plane were retraced without reference to the long-axis views by a different observer from those who traced the borders for the 3D reconstruction. Tracings were made after review of the cine loop in each view, just as for the PSSS method. In the basal views, only the RV endocardium was traced; a straight line was drawn to connect the points at which the image plane intersected with the tricuspid annulus to exclude the right atrium. The borders traced for PSSS reconstruction in the middle of the right ventricle were made available to the observer performing Simpson’s analysis for review and editing, even though they had been traced with full view of the long-axis borders. This exception was made to minimize interobserver variability in identifying the endocardial contour in the hypertrophied right ventricles and also because the mid-RV views were relatively easy to delineate; they are not subject to partial volume effects because the image plane is nearly orthogonal to the ventricular wall.
The measurements using the PSSS method were considered the true values and were compared to those from Simpson’s method using a paired t test. A Bland-Altman analysis was performed to test for bias in the relation between the 2 methods. A p value <0.05 was considered statistically significant. The data are presented as the mean ± SD.
Results
The patients were slightly younger (mean age 35 ± 17 years, range 12 to 70) than the normal subjects (mean age 49 ± 12, range 26 to 56; p = NS). Of the 18 subjects in the patient group, 11 were men and 7 were women; of the 6 patients in the normal group, 1 was a man and 5 were women. Their end-diastolic volume ranged from 113 to 413 ml and the ejection fraction from 19% to 55%.
The volumes computed using Simpson’s method averaged 12 ± 19 ml lower than the volumes computed from PSSS reconstructions in the population as a whole (n = 48, end-diastole and end-systole combined, p <0.001; Figure 2 ). The Bland-Altman analysis showed that no bias was present in the underestimation (p = NS; Figure 2 ). When the volume difference was expressed as a percentage of the PSSS volume, the underestimation using Simpson’s method averaged 7 ± 12% (5 ± 3% at end-diastole, 8 ± 13% at end-systole). The ejection fraction was similar using both methods (35 ± 11% and 37 ± 12%, respectively, p = NS). Similar trends were seen in both subgroups, except that Simpson’s method overestimated the ejection fraction in normal subjects ( Table 1 ). The difference between the PSSS and Simpson volumes and the ejection fraction was also similar when comparing patients with dextro-transposition of the great arteries and those with levo-transposition of the great arteries.
| Parameter | Subjects (n) | PSSS | Simpson’s | p Value ⁎ |
|---|---|---|---|---|
| End-diastolic volume (ml) | ||||
| Normal | 6 | 156 ± 39 | 147 ± 36 | NS |
| Transposition of great arteries | 18 | 248 ± 69 | 236 ± 75 | 0.009 |
| End-systolic volume (ml) | ||||
| Normal | 6 | 76 ± 20 | 65 ± 17 | NS |
| Transposition of great arteries | 18 | 176 ± 62 | 164 ± 56 | 0.027 |
| Ejection fraction (%) | ||||
| Normal | 6 | 52 ± 3 | 56 ± 3 | 0.001 |
| Transposition of great arteries | 18 | 30 ± 7 | 31 ± 7 | NS |
Stay updated, free articles. Join our Telegram channel

Full access? Get Clinical Tree


