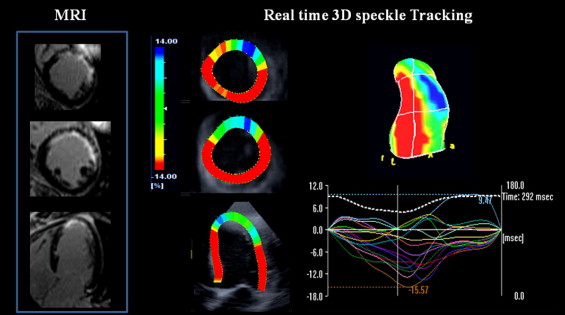
This study compared strain values from 2-dimensional (2D) and real-time 3-dimensional (3D) speckle tracking with hyperenhancement transmural extent by magnetic resonance imaging (MRI). The study included 18 control subjects (mean age 51 ± 10 years) and 25 patients (20 men, mean age 62 ± 16 years) with ischemic left ventricular (LV) dysfunction (mean LV ejection fraction 41 ± 9%) referred for viability assessment using MRI. Longitudinal, radial, and circumferential strain values were computed using 2D speckle tracking. From analysis of 3D speckle tracking, conventional strain markers (longitudinal, radial, and circumferential) and 2 new 3D strain indexes (area and 3D strains) were obtained from apical view 3D datasets. A hyperenhancement transmural extent segment (16-segment model) was defined as delayed contrast enhancement >50%. Overall, 661 of 688 segments (96%) were analyzable by MRI and 3D speckle tracking. All 3D strain components in hyperenhancement transmural extent segments (n = 154) were lower than in nontransmural necrosis (n = 219) and control (n = 288) segments. Longitudinal strain by 3D, but not by 2D, differentiated nontransmural segments with scar <25%. All 3D global strain indexes correlated with LV ejection fraction (r 2 = 0.67 to 0.26, p <0.05 for all comparisons), whereas only area, longitudinal, and circumferential 3D strains correlated with global scar extent. The best reproducibility was provided by 3D longitudinal (6%) and area (8%) strains. In conclusion, longitudinal and area strains by 3D speckle tracking provide an accurate and reproducible measurement of myocardial deformation that correlate with infarct size in patients with ischemic LV dysfunction.
Assessment of systolic left ventricular (LV) function is based on visual wall motion analysis and measurement of LV ejection fraction (LVEF) using 2-dimensional (2D) echocardiographic imaging. However, wall motion analysis is subjective and poorly reproducible and LVEF is poorly sensitive in detecting early myocardial dysfunction. Recent studies have shown that myocardial deformation index using strain and strain rate may be superior to wall motion analysis and LVEF in predicting outcome in ischemic and nonischemic patients. Strain can be computed from tissue Doppler imaging and, more recently, from 2D speckle tracking, which allows assessment of strain data without the issue of ultrasonic angle dependency. However, despite the accuracy of speckle tracking, 2D strain remains inherently limited because 2D imaging cannot visualize the entire myocardium. Recently, new 3-dimensional (3D) speckle-tracking software has allowed quantification of strain data from a real-time 3D dataset, but studies evaluating the accuracy of 3D strain obtained from speckle-tracking analysis have been limited. In this setting, we performed a comparison study between strain data obtained by 3D speckle tracking and myocardial infarct size assessed by magnetic resonance imaging (MRI).
Methods
The study included 18 control subjects and 25 ischemic patients with myocardial dysfunction (LVEF <50%) and a history of acute myocardial infarction. All patients underwent coronary angiography to confirm the presence of coronary artery disease and an MRI study 1 month after acute myocardial infarction. Comprehensive 2D and 3D echocardiography was performed immediately on the same day as the MRI study. In the patient group 33 consecutive patients were initially selected but only 25 were included in the final analysis (8 were excluded because a poor acoustic window prevented 3D analysis). The control group included healthy volunteers with no history of cardiac disease, hypertension, or diabetes mellitus. All patients provided informed consent and the study was approved by the local ethics committee of Henri Mondor University Hospital.
Comprehensive echocardiographic imaging was performed using a commercially available echocardiographic system (Artida 4D, Toshiba Medical Systems, Tokyo, Japan). 2D (PST-30SBT probe), apical (4-, 2-, and 3-chamber apical views), and short-axis (midventricular) views were acquired using the harmonic mode with a high frame rate (>40 frames/cardiac cycle). For all strain analyses, end-diastolic timing was defined at peak R wave using electrocardiographic tracing. Longitudinal 2D strain by speckle tracking was computed from gray-scale apical views (Toshiba Medical Systems software), and radial and circumferential strain values were derived from the short-axis view at the midventricular level (6 segments). One short-axis view was acquired with the papillary muscle as a tag to facilitate the comparison between MRI and strain data. Peak strain was automatically determined as the largest negative strain value during the cardiac cycle for longitudinal and circumferential strains and the largest positive strain value for the radial component.
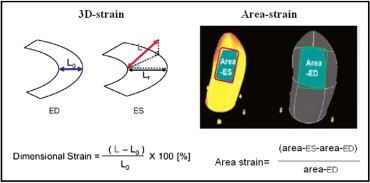
A 3D LV full-volume dataset was acquired during breath hold using 4 cardiac cycles to ensure an optimal volume rate (mean volumes per cardiac cycle 16 ± 3). 3D speckle tracking was performed using dedicated wall motion tracking software (Toshiba Medical Systems; Figure 1 ) . Automatic endocardial delineation was obtained after manual positioning of the mitral plane and LV apex (on 4- and 2-chamber views). Endocardial borders were adjusted to optimize LV tracking. For 3D speckle-tracking analysis, 3D cubic templates were tracked frame by frame during the cardiac cycles to determine 3D vectors used to compute the 3 conventional strain components (radial, longitudinal, and circumferential). In addition, 2 new vectors were calculated: a 3D strain vector and a 3D area strain ( Figure 2 ) . The 3D strain vector was obtained by summing the radial, circumferential, and longitudinal vectors. The 3D area strain vector was obtained by computing the changes in endocardial area.


Cardiac MRI was performed with a 1.5-T system (Avanto, Siemens Medical Systems, Erlangen, Germany). Patients were positioned in the supine position with a cardiac 6-element phased-array coil placed over the chest. LV volumes and LVEFs were computed from gated and breath-hold LV cine short-axis views, respectively, acquired using a steady-state free precession sequence with the following parameters: image matrix 192 × 156, field of view 240 mm, repetition time 31 ms, echocardiographic time 1.40 ms, flip angle 81°, slice thickness 6 mm, no slice gap, and 25 heart phases per cardiac cycle. A stack of LV cine short-axis views was obtained with the first slice positioned at the LV base covering the mitral valve and the last slice covering the LV apex. Transmural necrosis extent was computed from delayed contrast-enhanced imaging obtained during breath hold, 10 to 20 minutes after intravenous administration of contrast agent gadolinium 0.2 mmol/kg (Dotarem, Guerbet, France) at the rate of 3.5 mL/s. A 3D inversion, recuperation, gradient echocardiographic T1-weighted sequence was acquired during the diastolic phase for late contrast-enhanced imaging. A dedicated inversion time scouting sequence was systematically used to adjust the optimal inversion recovery time. The sequence parameters were mean inversion time 220 ± 50 ms, repetition time 3.9 ms, echocardiographic time 1.4 ms, flip angle 10°, matrix 192 × 192, field of view 300 × 270 mm, 12 sections, and section thickness 4 mm. Image acquisition lasted 12 to 20 seconds depending on heart rate. Two complete sets of contiguous short-axis sections (24 sections) were acquired. Assessment of the transmural extent of delayed hyperenhancement was performed on the late-enhanced cardiac MRI images (from short-axis views; Figure 1 ) as previously described. Briefly, images were binarized to a threshold of 2 SDs above the mean value obtained in remote normal segments without hyperenhancement. Transmural extent of hyperenhancement was computed within each segment (16-segment model) on these thresholded images and reported as percent segmental area that was hyperenhanced. Necrosis was categorized as nontransmural (hyperenhancement 0% to 25% and 25% to 50%) or transmural (hyperenhancement 50% to 75% and 75% to 100%). Mean hyperenhancement transmural extent within the 16 segments was used to determine the global extent of scar tissue per patient (for direct comparison to global LV strain determined using the 2D and 3D speckle-tracking approaches).
Continuous variables were tested for normal distribution using the Kolmogorov–Smirnov method and expressed as mean ± SD; nominal variables were expressed as percentages. Comparisons between groups were performed using Student’s t test or analysis of variance for continuous variables and chi-square test for percentages. Multilevel analysis was used for comparing strain values between groups. Linear regression analysis was performed to compare continuous variables. Reproducibility was performed in 10 random patients (160 strain values) by an operator blinded to MRI data and was expressed as 2 SDs of the absolute difference between 2 measurements over the mean. Interclass correlation was also provided. Statistical difference was considered when the p value was <0.05.
Results
Characteristics of the patient population are presented in Table 1 . The mean age of the control group was 51 ± 10 years. All segments were analyzable by 3D speckle tracking and 661 of 688 (96%) by MRI. Nonanalyzable segments were located in the apical portion of the left ventricle, where partial volume issue prevented an accurate delineation of the endocardial border. In the patient group, 31% of segments (n = 154) had transmural necrosis.
| Age (years) | 62 ± 16 |
| Men | 20 (80%) |
| Hypertension | 11 (44%) |
| Diabetes mellitus | 4 (16%) |
| Hyperlipidemia | 8 (32%) |
| Smoker | 13 (52%) |
| Reperfusion by percutaneous coronary intervention | 16 (64%) |
| Anterior acute myocardial infarction | 17 (68%) |
| Magnetic resonance data | |
| Left ventricular ejection fraction (%) | 41 ± 9 |
| End-diastolic volume (ml) | 160 ± 62 |
| End-systolic volume (ml) | 98 ± 48 |
| Heart rate (beats/min) | 76 ± 14 |
In the control group, regional strain values by 2D ( Table 2 ) and 3D speckle tracking ( Figure 3 ) were similar for longitudinal strain (−15 ± 8% vs −16 ± 9%) and circumferential strain (−19 ± 10% vs −17 ± 9%), whereas 3D radial strain was lower than for 2D radial strain (31 ± 26% vs 44 ± 31%, p <0.05). In the patient group, 2D speckle-tracking data showed that longitudinal and circumferential strain values differed between segments with and without transmural necrosis ( Table 2 ). In contrast, all conventional strain components (longitudinal, radial, and circumferential strains) obtained from 3D speckle tracking differed between transmural and nontransmural necrosis segments ( Figure 3 ). In addition, compared to 2D strain, longitudinal 3D strain was able to differentiate nontransmural necrosis segments with limited (0% to 25%, n = 169; Figure 4 ) and larger (25% to 50%, n = 50) scars. Interestingly, longitudinal and circumferential strains decreased progressively with severity of transmural extent of necrosis, whereas a decrease in radial strain value occurred only later, when transmural necrosis extent was >75% (n = 96; Figure 4 ).
| Variable | 2D Speckle Tracking | p Value ⁎ | ||
|---|---|---|---|---|
| Control | TME <50% | TME ≥50% | ||
| (n = 288) † | (n = 219) † | (n = 154) † | ||
| Longitudinal strain (%) | −15 ± 8 | −10 ± 6 ‡ | −8 ± 5 ‡ § | <0.0001 |
| Circumferential strain (%) | −17 ± 9 | −9 ± 10 ‡ | −6 ± 7 ‡ § | <0.0001 |
| Radial strain (%) | 44 ± 31 | 18 ± 22 ‡ | 16 ± 17 ‡ | <0.0001 |
† For circumferential and radial strains, n = 108 for controls, n = 96 for TME <50%, n = 66 for TME ≥50%.
‡ p <0.001 versus control group.
Stay updated, free articles. Join our Telegram channel

Full access? Get Clinical Tree


