The aim of this study was to prospectively investigate the clinical characteristics including symptoms and long-term mortality in patients with acute myocardial infarction (AMI) accidentally admitted to non-cardiology departments (NCDs). For comparison, similar observations in patients admitted to the coronary care unit (CCU) were collected. During a 1-year period, consecutive patients having cardiac troponin I measured at the Odense University Hospital were considered. The hospital has 27 clinical departments. Patients were classified as having an AMI if the diagnostic criteria of the universal definition were met. Follow-up was at least 1 year with mortality as the clinical end point. Of 3,762 consecutive patients, an AMI was diagnosed in 479, of whom 114 patients (24%) were hospitalized in NCDs and 365 (76%) in the CCU. Chest pain or chest discomfort more frequently occurred in patients from the CCU (83%) than in patients from the NCDs (45%, p <0.0001). At median follow-up of 2.1 years, 150 patients had died: 73 (64%) of patients from the NCDs and 77 (21%) of the patients from the CCU. In the multivariable Cox regression analysis, the adjusted hazard ratio of mortality for patients from the NCDs versus CCU was 2.0 (95% confidence interval 1.3 to 3.2). In conclusion, chest pain/discomfort was absent in more than half of the patients with AMI admitted to NCDs, and admission to NCDs was an independent predictor of a 2 times higher long-term mortality in comparison with admission to the CCU.
Highlights
- •
In patients with acute myocardial infarction, 1 in 4 were triaged to noncardiology departments.
- •
Patients with acute myocardial infarction referred to noncardiology departments had fewer typical symptoms.
- •
The adjusted mortality risk was doubled in noncardiology departments.
It occurs that patients with acute myocardial infarction (AMI) accidentally are referred to non-cardiology departments (NCDs)—even at hospitals with highly specialized cardiology services available. Potential causes for this may be low suspicion of AMI because of not only atypical symptoms and/or discrete electrocardiographic changes but also triaging through low-volume emergency departments. Moreover, severe co-morbidity at hospitalization may overrule the diagnosis of AMI when deciding on the appropriate triage. The clinical characteristics and prognosis of patients with AMI treated by non-cardiologists have been investigated in a number of retrospective, observational multicenter studies, and inconsistent conclusions have been reached. To the best of our knowledge, only 1 prospective study has been published so far, but only selected patients with ST-elevation AMI were addressed. The objectives of this prospective study were to investigate the clinical characteristics and long-term mortality in patients with AMI, who were admitted to NCDs in a large university hospital. For comparison, similar observations in patients admitted directly to the coronary care unit (CCU) were collected.
Methods
This is a substudy of the DEF-AMI study (“Consequences of the universal Definition of Acute Myocardial Infarction studied prospectively in a Danish consecutive hospital population”). Odense University Hospital has 1,000 beds and serves not only as a tertiary referral center for a region of 1.2 million inhabitants but also as the local hospital for a catchment area of 300,000 residents. The hospital has 27 clinical departments including a CCU with an intensive care section and round-the-clock facilities for primary percutaneous coronary intervention (PCI). During the inclusion period of 1 year (January 6, 2010, to January 5, 2011), all in-patients, in whom cardiac troponin I (cTnI) had been measured, were traced through retrieval 3 times daily at the Department of Clinical Biochemistry of the hospital. Within 24 hours of the first cTnI sampling, all patients had a supplementary history taken by dedicated study personnel, who paid special attention to symptoms on admission, clinical characteristics, and co-morbidity. The study personnel did not interfere with the management of the patients. We only included co-morbidity, which could be validated by confirmation from the patient’s medical records or by the list of current medication. Management of patients with AMI was according to the guidelines from the European Society of Cardiology. Only patients living in the local catchment area were included as we wanted to avoid selection bias because of high-risk transferees from less specialized hospitals to Odense University Hospital. Other exclusion criteria were measurement of cTnI outside the central laboratory of the hospital and age <18 years. Furthermore, only the first admission of a patient was considered in case of more admissions during the inclusion period.
The cTnI was analyzed by Architect c16000 (Abbott Diagnostics, Abbott Park, Illinois), which has a detection limit of 0.01 μg/L, with an upper reference limit of 99th percentile of 0.028 μg/L and a coefficient of variation <10% at 0.032 μg/L. Thus, in this study, a cTnI value >0.03 μg/L was considered the decision limit for the diagnosis of an AMI. Based on the presenting electrocardiograms, the type of AMI was categorized as an ST-elevation myocardial infarction (STEMI) or a non–ST-elevation myocardial infarction (NSTEMI) as defined by the universal definition. Patients with new (or presumably new) left bundle branch block were classified as STEMI. Cases of AMI associated with coronary revascularization procedures (type 4 and 5 AMI) were excluded.
The clinical characteristics and objective findings including cTnI values and electrocardiograms from the index event of the considered patients were evaluated by 3 cardiologists at the hospital to establish or rule-out the diagnosis of AMI. Cases of diagnostic ambiguities were presented to the Co-Chairman of the Universal Definition Task Force (KT) on a monthly basis to reach consensus on the diagnosis. The following variables were registered: age, gender, history of diabetes, hypercholesterolemia, hypertension, smoker, family history of AMI, previous AMI, previous coronary artery bypass grafting (CABG), previous PCI, heart failure, previous stroke, peripheral arterial disease, renal failure, chronic obstructive pulmonary disease, and arrhythmia. Information about laboratory and clinical tests were retrieved from the patients’ individual electronic records. If coronary angiography was performed, the results were collected from the Western Denmark Heart Registry. The department to which the patient was initially admitted was registered. All services outside the cardiology department were classified as NCDs. The prescribed cardiovascular medication reimbursed by the patients within 3 months before hospital admission and 3 months after discharge was traced through the Odense Pharmaco-epidemiological Database. On October 12, 2012, the number of deaths was retrieved from the Danish Civil Personal Registration System. Causes of death were obtained from the Danish Register of Causes of Death.
Continuous variables are presented as medians (with the interquartile range) or as means (±SD), depending on how appropriate the normality assumption was as judged graphically by means of histograms and approximating normal distributions. Categorical variables are listed as numbers (%). The Mann-Whitney U test has been used to test for intergroup differences for continuous variables. The Pearson’s chi-square test has been used for intergroup comparison of categorical variables in 2 × 2 tables. In case of observed cell frequencies of ≤10, Fisher’s exact test was applied instead.
Propensity score was performed using the following variables: age, gender, lipothymia, vertigo, tachycardia, dyspnea, angina pectoris, diabetes mellitus, hyperlipidemia, hypertension, family history, current or previous smoker, previous AMI, previous CABG, previous PCI, heart failure, previous stroke, peripheral arterial disease, renal failure, chronic obstructive pulmonary disease, and STEMI. The derivation of the GRACE score (2.0) was done according to the SAS (Statistical Analysis System) codes provided by the Center for Outcomes Research, University of Massachusetts Medical School.
Unadjusted survival data have been plotted as Kaplan-Meier curves, and comparison between groups has been done using log-rank statistics. Univariate and multivariate Cox regression analyses were used to evaluate the prognostic significance of the following variables concerning mortality at follow-up: admission to CCU or to NCDs, age, gender, smoker (current or previous), hypertension, diabetes, hypercholesterolemia, family history of cardiovascular disease, previous AMI, heart failure, previous stroke, chronic obstructive pulmonary disease, arrhythmia, first cTnI value, peak cTnI value, hemoglobin level, leukocyte level, plasma creatinine level, C-reactive protein, heart rate, left ventricular ejection fraction, temperature, oxygen saturation, STEMI, or NSTEMI. Variables with p <0.20 in the univariate Cox regression analyses were included in the multivariate Cox regression model except the temperature and oxygen saturation. Variable selection was performed in the multivariate Cox regression analysis as a stepwise backward elimination method, each time excluding the 1 variable with the highest p value. The final model included variables with p <0.05. All analyses have been performed using STATA/IC 11 (StataCorpLP, College Station, Texas) and SAS 9.1.3 (SAS Institute Inc., Cary, North Carolina). The study complied with the Declaration of Helsinki and was approved by the Danish National Committee on Biomedical Research Ethics and the Danish Data Protection Agency.
Results
Of the 7,230 admissions having cTnI measured during the 1-year period, 2,277 were residents from outside the hospital’s local catchment area and were accordingly excluded. Another 737 cases were readmissions resulting in a study population of 3,762 different patients ( Figure 1 ). It was found that 479 patients had an AMI, of whom 114 (24%) were admitted to NCDs and 365 (76%) to the CCU.

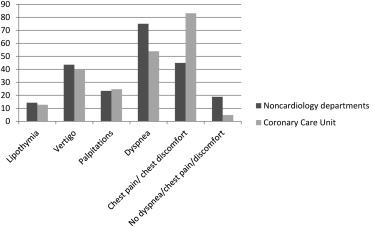
Patients from the NCDs were older, more often women, and exhibited more co-morbidity than patients from the CCU ( Table 1 ). Of patients from the NCDs, 75% (72 of 96) presented with dyspnea at admission versus half (175 of 325) of the patients from the CCU (p <0.0001; Figure 2 ). Within the first 3 months after hospital discharge, significantly fewer patients from the NCDs received cardioactive medication ( Table 2 ). Early coronary revascularization procedures were done in 10% (11 of 114) of the patients from the NCDs versus 55% (201 of 365) of the patients from the CCU (p <0.0001; Table 1 ).
| Variable | NCDs (n = 114) | CCU (n = 365) | p Value |
|---|---|---|---|
| Age (years) mean (SD) | 80 (10.5) | 69 (12.8) | <0.0001 |
| Men | 49 (43%) | 244 (67%) | <0.0001 |
| Current or prior smoker—no./total | 98/111 (88%) | 277/362 (77%) | 0.007 |
| Hypertension ∗ | 67 (59%) | 192 (53%) | 0.26 |
| Diabetes mellitus | 24 (21%) | 50 (13%) | 0.06 |
| Hypercholesterolemia ∗ | 44 (39%) | 141 (39%) | 1.0 |
| Family history ∗ —no./total | 9/36 (25%) | 95/310 (31%) | <0.0001 |
| Prior myocardial infarction | 27 (24%) | 70 (19%) | 0.30 |
| Prior coronary artery bypass surgery | 8 (7%) | 29 (8%) | 0.75 |
| Prior percutaneous coronary intervention | 15 (13%) | 45 (12%) | 0.82 |
| Heart failure | 19 (17%) | 39 (11%) | 0.09 |
| Prior stroke | 26 (23%) | 41 (11%) | 0.002 |
| Peripheral arterial disease | 14 (12%) | 23 (6%) | 0.04 |
| Renal failure | 14 (12%) | 19 (5%) | 0.009 |
| Chronic obstructive pulmonary disease | 35 (31%) | 34 (9%) | <0.0001 |
| Prior arrhythmias | 19 (17%) | 38 (10%) | 0.07 |
| Recent noncardiac surgery † | 5 (5%) | 4 (1%) | 0.03 |
| First troponin I value (μg/L) median (IQR) | 0.4 (0.1–1.3) | 0.2 (0.1–1.4) | 0.02 |
| Peak troponin I value (μg/L) median (IQR) | 1.4 (0.5–5.8) | 2.8 (0.4–15.9) | 0.05 |
| Hemoglobin (mmol/L) mean (SD) | 7.5 (1.7) | 8.2 (1.2) | <0.0001 |
| Leukocytes (10E9/L) median (IQR) | 12.7 (9.4–17) | 10.1 (7.7–12.6) | <0.0001 |
| Creatinine (enzymatic)-P (μmol/L) median (IQR) | 101 (75–134) | 84 (70–103) | 0.001 |
| C-reactive protein (mg/L) median (IQR) | 44.5 (4–85.8) | 4 (1–12) | <0.0001 |
| Systolic blood pressure (mm Hg) mean (SD) | 139 (41.4) | 145 (42.8) | 0.21 |
| Heart rate (beats/minute) mean (SD) | 101 (32) | 87 (36) | 0.0003 |
| Killip class 1 | 85 (75%) | 286 (79%) | 0.04 |
| Killip class 2 | 15 (13%) | 25 (7%) | — |
| Killip class 3 | 9 (8%) | 19 (5%) | — |
| Killip class 4 | 5 (4%) | 35 (10%) | — |
| Ejection fraction (%) median/total no. (IQR) | 35/83 (35–55) | 50/329 (40–55) | 0.04 |
| Temperature (°C) mean/total no. (SD) | 37.1/100 (1.2) | 36.4/254 (9.0) | <0.0001 |
| O 2 saturation—median (IQR) | 91 (83–96) | 97 (95–99) | <0.0001 |
| ST-elevation myocardial infarction | 11 (10%) | 122 (33%) | <0.0001 |
| 2.0 GRACE risk score—mean/total no. (SD) | 192/99 (30.6) | 170/339 (42.3) | <0.0001 |
| Type 2 myocardial infarction | 56 (49%) | 63 (17%) | <0.0001 |
| Coronary angiography | 19 (17%) | 277 (76%) | <0.0001 |
| Percutaneous coronary intervention | 11 (10%) | 192 (53%) | <0.0001 |
| Coronary artery bypass surgery | 0 | 9 (2%) | 0.1 |
| Duration of admission (days)—median (IQR) | 7 (4–11) | 3 (2–5) | <0.0001 |
∗ Definitions: Hypertension—from medical history and/or prescription of antihypertensive drugs; hypercholesterolemia—from medical history and/or prescription of statins; family history—first-line family members having cardiac disease.
| Variable | Before Hospitalization 3 Months Period | After Discharge 3 Months Period | ||||
|---|---|---|---|---|---|---|
| NCDs (n = 114) | CCU (n = 365) | p Value | NCDs (n = 114) | CCU (n = 365) | p Value | |
| Platelet aggregation inhibitors | 51 (45%) | 93 (26%) | <0.0001 | 61 (54%) | 264 (72%) | <0.0001 |
| • Clopidogrel | 6 (5%) | 15 (4%) | 0.60 | 23 (20%) | 194 (53%) | <0.001 |
| • Aspirin | 48 (42%) | 87 (24%) | <0.0001 | 53 (47%) | 213 (58%) | 0.03 |
| • Prasugrel | 0 | 0 | 0 | 6 (2%) | 0.34 | |
| Statins | 31 (27%) | 107 (29%) | 0.66 | 29 (25%) | 225 (62%) | <0.0001 |
| Beta-blockers | 29 (25%) | 74 (20%) | 0.24 | 31 (27%) | 221 (61%) | <0.0001 |
| ACE inhibitor/AT-II antagonists | 43 (38%) | 107 (29%) | 0.09 | 33 (29%) | 159 (44%) | 0.0005 |
| Warfarin | 5 (4%) | 20 (6%) | 0.81 | 3 (3%) | 26 (7%) | 0.11 |
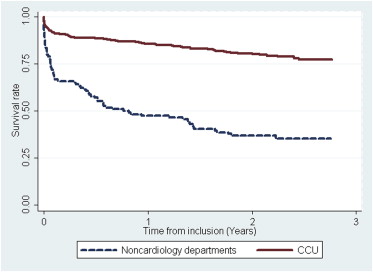
At a median follow-up of 2.1 years (IQR 1.6 to 2.5 years), 150 of 479 patients had died: 64% (73 of 114) from NCDs and 21% (77 of 365) from the CCU ( Figure 3 ). The in-hospital, 30-day, and 1-year mortality in patients from the NCDs were 20% (23 of 114), 27% (31 of 114), and 53% (60 of 114) versus 7% (25 of 365), 8% (28 of 365), and 14% (52 of 365) in patients from the CCU. At the time of preparing this report, mortality causes from the Danish Register of Causes of Death were available up till December 31, 2011. Cardiovascular death had occurred in 98 patients in total and more frequently in patients from the NCDs (40%, 46 of 114) versus patients from the CCU (14%, 52 of 365; p <0.0001). Variables predicting all-cause mortality at follow-up according to the univariate Cox regression analyses are presented in Table 3 . Multivariate Cox regression analyses are depicted in Table 4 . The hazard ratio of mortality for patients from the NCDs compared with patients from the CCU was 2.0 (95% confidence interval 1.3 to 3.2; Table 4 ). After correction for propensity score and Grace score (2.0), the mortality hazard ratio remained higher in patients from the NCDs (1.8, 95% confidence interval 1.1 to 3.0; p = 0.01).
Stay updated, free articles. Join our Telegram channel

Full access? Get Clinical Tree


