The present study sought to elucidate the geometry of the left ventricular outflow tract (LVOT) in patients with aortic stenosis and its effect on the accuracy of the continuity equation-based aortic valve area (AVA) estimation. Real-time 3-dimensional transesophageal echocardiography (RT3D-TEE) provides high-resolution images of LVOT in patients with aortic stenosis. Thus, AVA is derived reliably with the continuity equation. Forty patients with aortic stenosis who underwent 2-dimensional transthoracic echocardiography (2D-TTE), 2-dimensional transesophageal echocardiography (2D-TEE), and RT3D-TEE were studied. In 2D-TTE and 2D-TEE, the LVOT areas were calculated as π × (LVOT dimension/2) 2 . In RT3D-TEE, the LVOT areas and ellipticity ([diameter of the anteroposterior axis]/[diameter of the medial-lateral axis]) were evaluated by planimetry. The AVA is then determined using planimetry and the continuity equation method. LVOT shape was found to be elliptical (ellipticity of 0.80 ± 0.08). Accordingly, the LVOT areas measured by 2D-TTE (median 3.7 cm 2 , interquartile range 3.1 to 4.1) and 2D-TEE (median 3.7 cm 2 , interquartile range 3.1 to 4.0) were smaller than those by 3D-TEE (median 4.6 cm 2 , interquartile range 3.9 to 5.3; p <0.05 vs both 2D-TTE and 2D-TEE). RT3D-TEE yielded a larger continuity equation-based AVA (median 1.0 cm 2 , interquartile range 0.79 to 1.3, p <0.05 vs both 2D-TTE and 2D-TEE) than 2D-TTE (median 0.77 cm 2 , interquartile range 0.64 to 0.94) and 2D-TEE (median 0.76 cm 2 , interquartile range 0.62 to 0.95). Additionally, the continuity equation-based AVA by RT3D-TEE was consistent with the planimetry method. In conclusion, RT3D-TEE might allow more accurate evaluation of the elliptical LVOT geometry and continuity equation-based AVA in patients with aortic stenosis than 2D-TTE and 2D-TEE.
Severe aortic stenosis is defined as a valve area <1.0 cm 2 or mean gradient >40 mm Hg. However, there are often discrepancies among planimetry, continuity equation-based aortic valve area (AVA), and pressure gradient. In part because of this discrepancy, the indication for aortic valve replacement has often been vague. The accuracy of AVA using the continuity equation depends primarily on the precise measurement of the left ventricular outflow tract (LVOT). Hitherto, the LVOT area has been calculated as π × (LVOT dimension/2) , when assuming a circular shape, although the LVOT could actually be elliptical. The aims of the present study were to investigate the shape of the LVOT using real-time 3-dimensional transesophageal echocardiography (RT3D-TEE), to compare the LVOT areas and the AVA derived from 2-dimensional transthoracic echocardiography (2D-TTE), 2-dimensional transesophageal echocardiography (2D-TEE), and RT3D-TEE, and to investigate the reason for the discrepancy of aortic stenosis severity between the continuity equation-based AVA and transvalvular pressure gradient.
Methods
We prospectively enrolled 49 consecutive subjects with calcific degenerative aortic stenosis who were referred for echocardiographic evaluation and had all 3 following studies: 2D-TTE, 2D-TEE, and RT3D-TEE from October 2010 to March 2011. Aortic stenosis was defined as a continuity equation-based AVA of <2.0 cm 2 in 2D-TTE. Patients with previous valvular heart surgery, mixed aortic valve disease (aortic stenosis and aortic regurgitation with greater than or equal to moderate aortic regurgitation [n = 3]), or greater than or equal to moderate mitral regurgitation (n = 4), and suboptimal 3-dimensional images (n = 2) were excluded. Finally, 40 patients were analyzed. Data collection and analysis were performed with approval by the institutional review board.
In 2D-TTE, the iE33 ultrasound system (Philips Medical Systems, Andover, Massachusetts) equipped with S5-1 phased array transducer (Philips Medical Systems) was used. Doppler flow data were acquired from the LVOT 2 mm below the annulus in the pulsed wave mode and through the aortic valve orifice in the continuous wave mode, in the best view to obtain the highest aortic valve velocity. The peak pressure gradients were obtained from a simplification of the complete Bernoulli equation: Δp (in mm Hg) = 4 v , 2 where v is the maximal jet velocity expressed in meters per second. The mean pressure gradients were calculated by averaging the instantaneous gradients over the ejection period using the modified Bernoulli equation. The LVOT diameter 2 mm below the annulus was measured in the parasternal long-axis view in the midsystolic phase. Subsequently, the LVOT area was calculated, assuming a circular shape (π × [LVOT dimension/2] ). The AVA was estimated using the continuity equation method: AVA = LVOT area × (time-velocity integral) LVOT/(time-velocity integral) aortic stenosis jet. Image processing was performed off-line using the VERICIS Echo Review Application (Camtronics Medical Systems, Hartland, Wisconsin). Planimetry was also performed to measure the AVA as the smallest area at midsystole.
On a different day within 1 week from when the patients underwent 2D-TTE, 2D-TEE was performed using a 3-dimensional matrix-array transesophageal transducer (X7-2t, Philips Medical Systems, Andover, Massachusetts). After the least amount of sedation to minimize distress for patients was administered with either intravenous propofol or the combination of midazolam and fentanyl, the TEE probe was advanced into the esophagus. From the midesophageal position, the LVOT images in the long-axis view (120° to 150°) were obtained, and its anteroposterior diameter was measured 2 mm below the annulus in the midsystolic phase. The LVOT area was calculated, assuming a circular shape (π × [LVOT dimension/2] ). Planimetry was also performed to measure the AVA as the smallest area at midsystole.
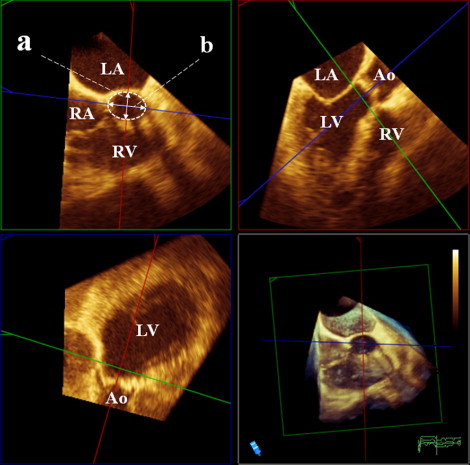
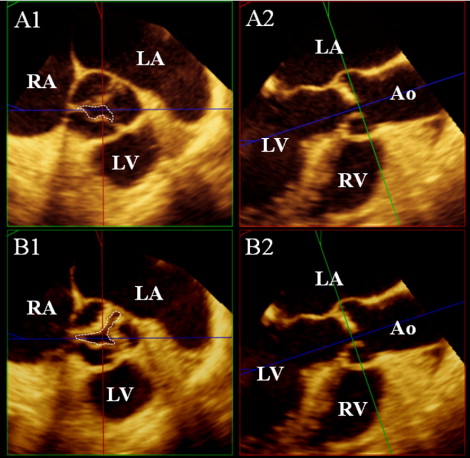
At the same time as the 2D-TEE, RT3D-TEE was performed with the same system. From the midesophageal position, 3-dimensional data sets were acquired with the LVOT and aortic valve in the center to include the LVOT and the aortic valve. All volumetric images were analyzed off-line using commercial software (3D-QLab, Philips Ultrasound, Andover, Massachusetts). The CV mode was used for correct alignment and measurement. After choosing the midsystolic frame, from the long aortic axis view ( Figure 1 , upper right), a 2-dimensional plane was shifted and rotated to find the lowest plane of the valve hinge point as the annulus level and was further moved in parallel to obtain the 2-dimensional cutting view of LVOT 2 mm below the aortic annulus ( Figure 1 , upper left). The ellipticity of the LVOT was calculated as the anteroposterior diameter divided by the medial–lateral diameter. Subsequently, fine adjustments of the 2-dimensional plane were performed to obtain the smallest AVA with the magnified view mode, and the maximum aortic valve excursion was measured ( Figure 2 ).


Continuous data are expressed as the mean ± SD or median with interquartile ranges, with or without a normal distribution, respectively. Categorical data are presented as the number and percentage. The 2-sided paired t test or Mann-Whitney U test was used to compare 2 continuous variables with or without a normal distribution, respectively. Pearson’s correlation coefficient analysis and simple regression analysis were used to assess the relationship of LVOT areas. Bland-Altman analysis was performed to determine the bias and limits of agreement between devices. The Friedman test followed by the post hoc Dunn test was used to identify differences among LVOT areas and the continuity equation-based AVA from 2D-TTE, 2D-TEE, and RT3D-TEE. Intra- and interobserver agreement was performed for 10 measurements. The measurements were repeated by the same observer after an interval of ≥1 week and by a second independent blinded reader. The variability was then estimated by intraclass correlation, with good agreement defined as >0.80. A 2-tailed probability value of <0.05 was considered significant. All graph making and statistical analysis were performed using commercial statistical software, GraphPad Prism, version 5.0 (GraphPad, San Diego, California) and SPSS, version 17.0 (SPSS, Chicago, Illinois).
Results
The baseline characteristics of the study population are listed in Table 1 . There were 2 patients with bicuspid aortic valve, and we could not determine whether it was bicuspid or tricuspid owing to complex and severe calcification of the aortic valve in 3 other patients. All 40 patients had optimal images of the LVOT and the aortic valve for assessment by 2D-TEE and RT3D-TEE. However, 2D-TTE AVA was not determined by planimetry in 7 patients owing to suboptimal image quality.
| Variable | Value |
|---|---|
| Patient characteristic | |
| Age (years) | 82.8 ± 7.4 |
| Gender | |
| Male | 23 (57%) |
| Female | 17 (43%) |
| Height (cm) | 167.7 ± 9.8 |
| Body weight (kg) | 69.6 ± 16.4 |
| Body surface area (cm 2 ) | 1.78 ± 0.22 |
| Systolic blood pressure (mm Hg) | 124 ± 12.8 |
| Diastolic blood pressure (mm Hg) | 66.5 ± 9.3 |
| Creatinine (mg/dl) | 1.36 ± 0.74 |
| Ischemic heart disease | 17 (42%) |
| Cerebral vascular disease | 11 (27%) |
| Dyslipidemia | 23 (57%) |
| Diabetes mellitus | 20 (50%) |
| Smoker | 20 (50%) |
| Atrial fibrillation | 9 (22%) |
| Pacemaker implantation | 5 (12%) |
| Echocardiographic parameters | |
| Left ventricular end-diastolic dimension (mm) | 44.2 ± 7.5 |
| Left ventricular end-systolic dimension (mm) | 30.8 ± 8.6 |
| Left ventricular end-diastolic volume (ml) | 105 ± 37 |
| Left ventricular end-systolic volume (ml) | 50 ± 28 |
| Left ventricular interseptal thickness (mm) | 12.7 ± 2.8 |
| Left ventricular posterior wall thickness (mm) | 12.4 ± 2.1 |
| Left ventricular mass index (g/m 2 ) | 120 ± 41 |
| Fractional shortening (%) | 31 ± 11 |
| Ejection fraction (%) | 56 ± 15 |
| Left ventricular inflow velocity (cm/s) | |
| E wave | 113.6 ± 34.5 |
| A wave | 92.5 ± 38.9 |
| E/A | 1.42 ± 0.84 |
| Deceleration time (ms) | 260.5 ± 105.5 |
| Septal E′ (cm/s) | 8.4 ± 2.8 |
| E/E′ | 15.7 ± 7.2 |
| Aortic valve velocity (m/s) | 4.0 ± 0.9 |
| Peak aortic valve pressure gradient (mm Hg) | 66 ± 27 |
| Mean aortic valve pressure gradient (mm Hg) | 35 ± 14 |
| Time-velocity integral (cm) | |
| Aortic valve | 91.4 ± 28.0 |
| Left ventricular outflow tract | 19.9 ± 4.6 |
The shape of the LVOT was elliptical in midsystole ( Table 2 ). A total of 37 patients had a larger medial–lateral diameter than anteroposterior diameter and 3 had an almost circular shape of the LVOT. The anteroposterior diameter by RT3D-TEE (median 2.1 cm, interquartile range 2.0 to 2.3) was not significantly different from the diameter by 2D-TTE (median 2.2 cm, interquartile range 2.0 to 2.3, p = NS) or by 2D-TEE (median 2.2 cm, interquartile range 2.0 to 2.3, p = NS). The medial–lateral diameter of LVOT by RT3D-TEE (median 2.7 cm, interquartile range 2.4 to 3.0) was longer than the LVOT diameters measured by 2D-TTE and 2D-TEE (p <0.01, respectively). Additionally, the ellipticity was not associated with age (r = 0.07, p = NS), gender (p = NS), left ventricular end-diastolic and end-systolic dimension (r = −0.17, p = NS; r = −0.15, p = NS, respectively), interventricular wall thickness (r = −0.04, p = NS), ejection fraction (r = 0.26, p = NS), aortic valve flow velocity (r = −0.23, p = NS), body surface area (r = −0.22, p = NS), or blood pressure (r = 0.10, p = NS).
| Variable | Value |
|---|---|
| Left ventricular outflow tract diameter (cm) | |
| Two-dimensional transthoracic echocardiography | 2.2 (2.0–2.3) |
| Two-dimensional transesophageal echocardiography | 2.2 (2.0–2.3) |
| Real-time 3-dimensional transesophageal echocardiography | |
| Anteroposterior | 2.1 (2.0–2.3) |
| Medial–lateral | 2.7 (2.4–3.0) ⁎ |
| Ellipticity by real-time 3-dimensional transesophageal echocardiography | 0.80 ± 0.08 |
Stay updated, free articles. Join our Telegram channel

Full access? Get Clinical Tree


