Increased atrial volumes predict adverse cardiovascular events. Accordingly, accurate measurement of atrial size has become increasingly important in clinical practice. The area-length method is commonly used to estimate the volume. Disagreements between atrial volumes using echocardiography and other imaging modalities have been found. It is unclear whether this has resulted from differences in the measurement method or discrepancies among imaging modalities. We compared the right atrial (RA) and left atrial (LA) volume estimates using the area-length method for transthoracic echocardiography and cardiovascular magnetic resonance (CMR) imaging. Patients undergoing echocardiography and CMR imaging within 1 month were identified retrospectively. For both modalities, the RA and LA long-axis dimension and area were measured using standard 2- and 4-chamber views, and the volume was calculated using the area-length method for both atria. The echocardiographic and CMR values were compared using the Bland-Altman method. A total of 85 patients and 18 controls were included in the present study. The atrial volumes estimated using the area-length method were significantly smaller when measured using echocardiography than when measured using CMR imaging (LA volume 35 ± 20 vs 49 ± 30 ml/m 2 , p <0.001, and RA volume 32 ± 23 vs 43 ± 29 ml/m 2 , p = 0.012). The mean difference (CMR imaging minus echocardiography) was 14 ± 14 ml/m 2 for the LA and 10 ± 16 ml/m 2 for the RA volume. Similar results were found in the healthy controls. No significant intra- or interobserver variability was found within each modality. In conclusion, echocardiography consistently underestimated the atrial volumes compared to CMR imaging using the area-length method.
An increased atrial volume is an independent predictor of adverse cardiovascular events, including stroke and congestive heart failure. Accordingly, accurate measurement of the atrial size has become increasingly relevant to clinical practice. Most clinical studies have used echocardiographic measurements, because echocardiography is the most accepted and best validated modality for atrial volume quantification. The area-length method has often been chosen for atrial volume quantification, because it is simple, relatively quick, and can be done using standard acquisitions. More recently, cardiac magnetic resonance (CMR) imaging has been used for atrial volume quantification. Because the long-axis views obtained by CMR imaging are similar to those obtained echocardiographically, the area-length method should give similar results for both modalities. To our knowledge, no studies have investigated this assumption. We sought to compare the area-length method of atrial volume measurements for echocardiography and CMR imaging for both the left atrial (LA) and right atrial (RA) volumes.
Methods
Patients >18 years old who had been referred for CMR imaging at our institution were identified. The patients were eligible for inclusion if they had also undergone imaging with transthoracic echocardiography within 1 month before or after CMR imaging. The patients were excluded if any major clinical event was identified during the period between echocardiography and CMR imaging. Major clinical events were determined by chart review and included any cardiac surgery, hospital admission for heart failure or diuresis, completion of pregnancy, or transplantation. The patients were also excluded if either the echocardiogram or CMR image provided incomplete or inadequate views of the atria. In addition, 18 healthy volunteers were underwent echocardiography and CMR imaging on the same day, and the measurements and volumes for both echocardiography and CMR imaging were obtained using methods identical for the patients undergoing imaging, for separate analysis. The institutional review board at Oregon Health and Science University approved the present study.
Echocardiographic apical 2- and 4-chamber views were obtained with the subject in the left lateral decubitus position using routine laboratory standards to demonstrate the LV apex and mitral valve. CMR imaging was performed with the patients in the supine position. A vertical long-axis view was obtained through the mitral valve and LV apex, identified from the CMR axial scout images. This was followed by a single-phase short-axis stack through the ventricle, prescribed from the vertical long-axis image, from which the LV volume and function was obtained using published standards. The 4-chamber plane was prescribed from the vertical long-axis and short-axis scout images, through both the mitral and tricuspid valve openings and LV apex. All images were obtained using steady-state free precession with retrospective gating.
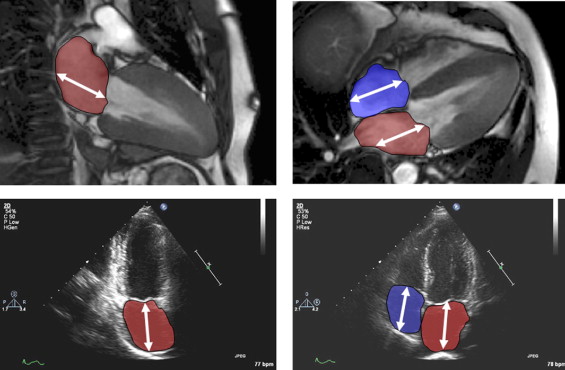
Standard 2- and 4-chamber views were evaluated off-line using commercially available software for both echocardiography (Syngo Dynamics Workstation 5.1.0, Siemens Medical Systems) and CMR imaging (CMR Tools, London, United Kingdom). One observer made all echocardiographic measurements and another did all the CMR imaging measurements. The observers were unaware of the findings of each other. Atrial diastole was determined by selecting the last frame in ventricular systole before mitral valve opening. The measurements were made according to published methods. The long-axis length of the left and right atria were defined by measuring the distance from the center of the mitral annulus to the posterior atrial wall. The atrial endocardial area was traced to exclude the atrial appendages and pulmonary or caval veins ( Figure 1 ).
Using the quantified length and area measurements, the LA and RA volumes from both echocardiography and CMR imaging were calculated. For the LA volume, we used the biplane area-length formula: volume = (0.848 × area 4ch × area 2ch /[(length 4ch + length 2ch )/2], where 4ch and 2ch is the 4-chamber and 2-chamber view, respectively. For the RA volume, the monoplane area-length formula was used: volume = 0.848 × (area 4ch ) 2 /length 4ch . All volumes were indexed to the body surface area obtained at CMR imaging.
Interobserver and intraobserver variability for the LA and RA volumes was examined for 10 patients who had undergone echocardiography and CMR imaging within a 24-hour period. The echocardiographic and CMR measurements were repeated by each observer, who were unaware of their first measurements (intraobserver variability). Each observer also measured the same patients using the other modality (interobserver variability). The differences were examined using the Bland-Altman method.
Statistical analysis was performed using Statistical Package for Social Sciences, version 13 (SPSS, Chicago, Illinois). For the entire cohort, the mean ± SD was calculated for the left and right volumes for both echocardiography and CMR imaging. The echocardiographic- and CMR-determined volumes were compared using Student’s t test, Pearson’s correlation, and Bland-Altman plots. The results are expressed as the mean ± SD, and p <0.05 was considered statistically significant.
Results
Of the 351 patients undergoing CMR imaging at our institution who were screened, 117 also had undergone transthoracic echocardiography within 1 month. Of these, 32 were excluded because of inadequate echocardiographic images (n = 17), inadequate CMR images (n = 7), or a major interval clinical event (n = 8). Thus, 85 patients were included in the present study. In 5 of these patients, the right atrium could not be accurately measured using echocardiography; thus, 80 patients were included for RA volume analysis.
The mean patient age was 52 ± 7 years, and 34% of the patients were women. The average body surface area of the patients was 2.0 ± 0.3 m 2 . The mean interval between echocardiography and CMR imaging was 3 ± 10 days (median 2). The clinical indications for CMR imaging included an assessment of viability (n = 26), a diagnosis of cardiomyopathy (n = 14), characterization of a cardiac mass (n = 6), clarification of echocardiographic findings (n = 8), an assessment of congenital heart disease (n = 10), suspected arrythmogenic right ventricular dysplasia (n = 6), and an assessment of aortic disease (n = 6). The average left ventricular ejection fraction of the patients was 49 ± 20%, and the average right ventricular ejection fraction was 49 ± 15%. The mean age of the healthy controls was 40 ± 11 years, and 36% of the controls were women. The average body surface area of the controls was 1.8 ± 0.2 m 2 .
For the patients, the LA and RA volumes estimated by echocardiography were significantly lower than the corresponding CMR volumes. The mean LA volume was 35 ± 20 ml/m 2 by echocardiography and 49 ± 30 ml/m 2 by CMR imaging (p <0.001). Similarly, the mean RA volume was 32 ± 23 ml/m 2 by echocardiography and 43 ± 29 ml/m 2 by CMR imaging (p = 0.012). The mean ratio (echocardiography/CMR) of the volume was 0.74 ± 0.22 for the left atrium and 0.78 ± 0.32 for the right atrium.
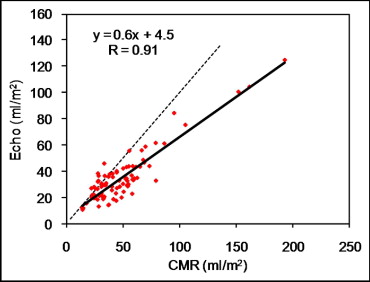
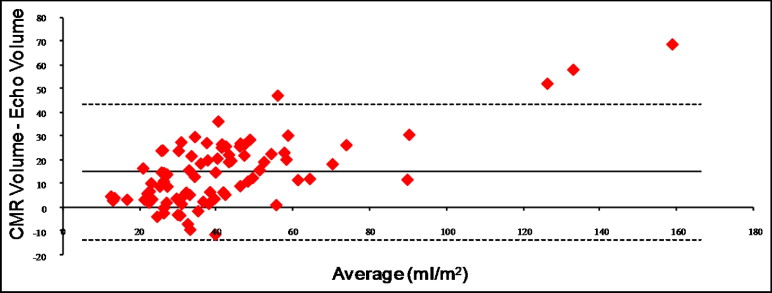
A strong linear correlation (r = 0.9) was seen between the LA volumes estimated by echocardiography and CMR, but the slope of the regression line was 0.6 ( Figure 2 ). The mean LA volume difference (CMR minus echocardiography) was 14.7 ± 14.3 ml/m 2 ( Figure 3 ). After excluding 3 patients with giant left atria (>100 ml/m 2 ), the mean LA difference (CMR minus echocardiography) was still 13 ml/m 2 (95% confidence interval 9 to 36 ml/m 2 ). The LA volume quartiles for CMR imaging were <60, 60 to 80, 81 to 100, and >100 ml/m 2 . To determine whether agreement improved using a single standardized view, the monoplane LA volumes were calculated using the 4-chamber measurements alone. No change was seen in the analysis trends.
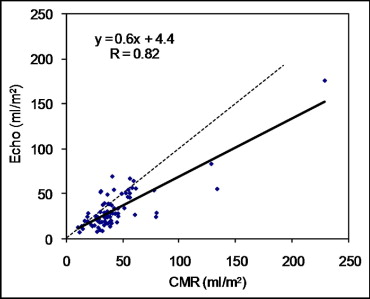
Similar findings were obtained for the right atrium. Despite the strong linear relation between the RA volumes estimated by echocardiography and CMR imaging (r = 0.8), the slope of the regression line was 0.6 ( Figure 4 ). After exclusion of 3 patients with a giant right atrium (>100 ml/m 2 ), the slope of the regression line remained 0.6. The mean RA volume difference (CMR minus echocardiography) was 10 ± 17 ml/m 2 ( Figure 5 ).
Stay updated, free articles. Join our Telegram channel

Full access? Get Clinical Tree


