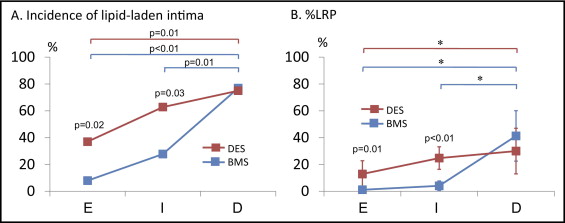
Recent studies have reported the development of neoatherosclerosis inside stents and subsequent acute coronary syndrome secondary to disruption of neointimal hyperplasia. The aim of the study was to compare the characteristics of neointimal hyperplasia and its time course between bare metal stents (BMSs) and drug-eluting stents (DESs) using optical coherence tomography. A total of 138 stents were divided into 3 groups according to the follow-up period: early phase, <9 months (25 BMSs and 27 DESs); intermediate phase, ≥9 and <48 months (18 BMSs and 43 DESs); and delayed phase, ≥48 months (13 BMSs and 12 DESs). Optical coherence tomographic analysis included the presence of lipid-laden intima, percentage of lipid-rich plaque, and signal attenuation. The optical coherence tomographic findings were compared between the BMSs and DESs in each period, and the difference between the periods was also determined. In the early phase, a greater incidence of lipid-laden plaque (37% vs 8%, p = 0.02) and a greater percentage of lipid-rich plaque (12.9 ± 25.1% vs 1.2 ± 4.3%, p = 0.01) were found in the DESs than in the BMSs. In the intermediate phase, the DES group continuously showed a significantly greater incidence of lipid-laden plaque (63% vs 28%, p = 0.03) and greater percentage of lipid-rich plaque (24.8 ± 28.1% vs 4.1 ± 7.3%, p <0.01). In addition, signal attenuation was greater in the DES group, suggesting early changes in neointimal hyperplasia properties. In the delayed phase, lipid-laden plaque was the predominant type in both groups. In conclusion, lipid-rich neoatherosclerosis develops inside stents earlier in DESs than in BMSs. After 48 months, most restenotic stents will have developed lipid-laden neointima in both groups.
A growing number of studies have reported the presence of neoatherosclerosis after stent implantation in bare metal stents (BMSs) and drug-eluting stents (DESs). The purpose of the present study was to investigate the incidence and tissue characteristics of neoatherosclerosis of BMSs and DESs at different points using optical coherence tomography (OCT).
Methods
The Massachusetts General Hospital OCT registry is a multicenter registry of patients undergoing OCT of the coronary arteries and includes 20 sites across 6 countries. Any patient who underwent OCT was eligible for the registry, regardless of symptoms. For the present study, we screened 989 patients in the Massachusetts General Hospital OCT registry. From those patients, we selected 138 stents from 124 patients that had ≥3 consecutive cross-sections at 1-mm intervals with a mean neointimal thickness >100 μm, as identified by OCT.
The stents were classified into 3 groups according to the duration since stent implantation: an early phase (<9 months, n = 52), an intermediate phase (≥9 to <48 months, n = 61), and a delayed phase (≥48 months, n = 25). The optical coherence tomographic findings were compared between the BMSs and DESs in each phase. Symptomatic restenosis was defined as a restenotic stent that was the culprit lesion of an acute coronary syndrome, including ST-segment elevation myocardial infarction, non–ST-segment elevation myocardial infarction, or unstable angina pectoris, or a target lesion of percutaneous coronary intervention for stable angina pectoris with Canadian Cardiovascular Society class II-IV symptoms. Hypertension was entered on the electronic case report form when the following definitions were met: a history of hypertension, the use of an antihypertensive drug, systolic blood pressure of ≥140 mm Hg, or diastolic pressure of ≥90 mm Hg. Hyperlipidemia was entered on the form if there was a history of hyperlipidemia, the presence of lipid-lowering therapy, or newly diagnosed hyperlipidemia according to institutional guidelines.
Coronary angiograms during follow-up were analyzed using off-line quantitative coronary angiography (Quantcor QCA, version 5.0, Pie Medical Imaging BV, Maastricht, The Netherlands). The reference diameter, minimum lumen diameter, diameter stenosis, and lesion length were measured.
Both the time-domain OCT system (M2/M3 Cardiology Imaging System, LightLab Imaging, Westford, Massachusetts) and the frequency-domain OCT system (C7-XR OCT Intravascular Imaging System, St. Jude Medical, St. Paul, Minnesota) were used in the present study. The technique of intracoronary OCT has been previously described. In brief, with the M2/M3 system, an occlusion balloon (Helios, LightLab Imaging) was advanced proximal to the lesion and inflated ≤0.4 to 0.6 atm during image acquisition. The imaging wire was automatically pulled back from distally to proximally at 1.0 to 3.0 mm/s, and saline was continuously infused from the tip of the occlusion balloon. With the C7 system, a 2.7F optical coherence tomographic imaging catheter (Dragonfly, LightLab Imaging) was advanced distal to the lesion, and automatic pullback was started as soon as the blood was cleared. All images were digitally stored, de-identified, and submitted to Massachusetts General Hospital (Boston, Massachusetts) for analysis.
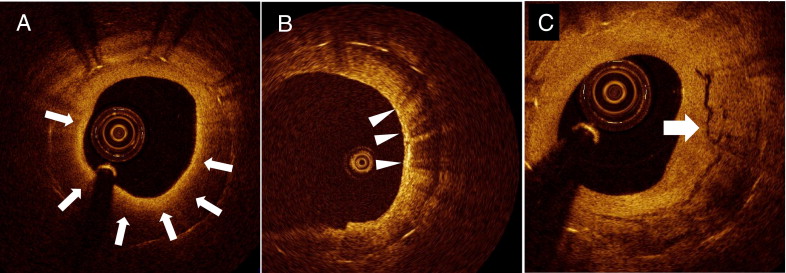
Cross-sectional optical coherence tomographic images of good quality were analyzed with a 1.0-mm interval for qualitative and quantitative evaluation. Qualitative analysis included the presence of lipid, macrophage, and neovascularization. Lipid was defined as a diffusely bordered signal-poor region with rapid signal attenuation. Lipid-laden intima was defined as a neointima with lipid ( Figure 1 ). For lipid-laden intima, the lipid arc and fibrous cap thickness were measured. Lipid-rich plaque (LRP) was defined as a plaque with a lipid arc >90°, and the %LRP was calculated as follows: %LRP = number of cross-sections with LRP/total number of analyzed cross-sections of plaque × 100. When the thinnest fibrous cap thickness was ≤65 μm in LRP, the plaque was defined as thin-cap fibroatheroma. Macrophage infiltration was defined as increased signal intensity accompanied by heterogeneous back shadows within the fibrous cap, as previously reported ( Figure 1 ). Neovascularization was defined as small vesicular or tubular structures with a diameter of 50 to 300 μm. The location of neovascularization was divided into intraintima or peristrut, as previously described ( Figure 1 ). The presence of disrupted neointima and thrombus was also recorded.

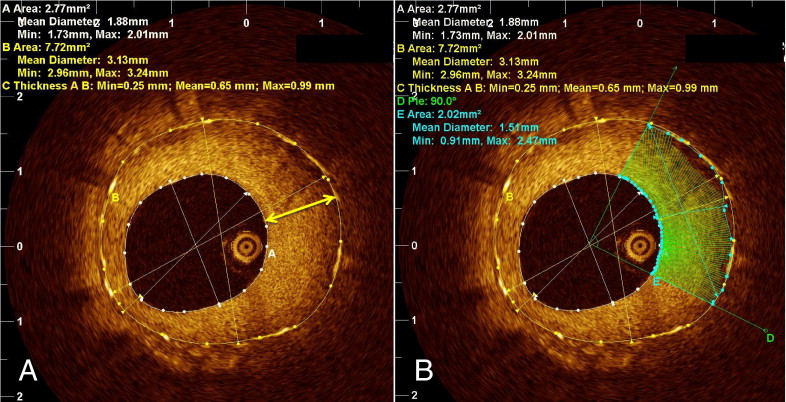
A quantitative assessment was performed using the OCT off-line analysis software (LightLab Imaging). Tissue property analysis software was used for quantitative assessment ( Figure 2 ). The analysis was performed only for cross-sections with a mean neointima thickness >100 μm. Images with insufficient blood clearance were excluded. The stent and lumen areas were traced, and the thickest neointima was automatically indicated. The region of interest was placed at a quadrant section of neointima that was centered at the portion with the maximum neointimal thickness. Previously reported tissue property parameters, including signal attenuation, backscatter, and normalized standard deviation (NSD), were automatically calculated by the software. In brief, signal attenuation represents the degree of attenuation of the signal according to the depth of the tissue, backscatter represents the signal strength of the backscattering, and NSD represents the signal variability of the backscattering within the sample. All optical coherence tomographic images were analyzed by 2 independent investigators (T.Y. and K.K.) who were unaware of the patients’ information. When discordance was present between the readers, a consensus reading was obtained from a third independent investigator (S.K.). The inter- and intraobserver reliability for tissue property analyses were assessed using a random subset of 50 patients from all 3 groups.

Categorical data are expressed as counts and percentages and were compared with the chi-square test or Fisher’s exact test, depending on the data type. Continuous measurements are expressed as the mean ± SD and were analyzed with the Student t test and analysis of variance. The %LRP comparisons between the 2 stent types at each phase and among the 3 phases within the same stent type were performed using analysis of variance and Duncan’s multiple range post hoc test using the natural log-transformed values, because the raw data were not normally distributed. We also performed the nonparametric tests (i.e., Mann-Whitney U test and Kruskal-Wallis test), and the resulting statistically significant findings were consistent with those from the log-transformed analysis of variance. We chose to report the log-transformed analysis of variance results, because they allowed us to then proceed to the post hoc test. The inter- and intraobserver reliabilities were estimated using the κ coefficient for binary outcomes and the intraclass correlation coefficient for continuous measurements. All statistical analysis was performed with SAS, version 9.1.3 (SAS Institute, Cary, NC). A p value <0.05 was considered statistically significant.
Results
Of all 124 patients, 1 had both BMSs and DESs (1 BMS and 2 DESs). The patient characteristics of the remaining 123 patients are listed in Table 1 . The 2 groups had a similar prevalence of risk factors. No significant difference was seen in the mean follow-up time from stent implantation. Most of the patients presented with stable angina, and no significant difference was present in the prevalence of acute coronary syndrome between the 2 groups during the follow-up period.
| Variable | BMSs (n = 50 ⁎ ) | DESs (n = 73 ⁎ ) | p Value |
|---|---|---|---|
| Age (years) | 64.6 ± 10.3 | 61.0 ± 10.9 | 0.07 |
| Male | 44 (88%) | 55 (75%) | 0.11 |
| Hypertension | 36 (72%) | 52 (71%) | 0.93 |
| Hyperlipidemia | 33 (66%) | 44 (60%) | 0.52 |
| Diabetes mellitus | 18 (36%) | 29 (40%) | 0.68 |
| Current smoker | 14 (28%) | 14 (19%) | 0.25 |
| Stent (n)/patient | 1.10 ± 0.24 | 1.08 ± 0.30 | 0.87 |
| Follow-up time (mo) | 26.4 ± 36.8 | 20.1 ± 20.6 | 0.23 |
| Clinical presentation | |||
| ST-segment elevation myocardial infarction | 1 (2%) | 0 (0%) | |
| Non–ST-elevation myocardial infarction/unstable angina pectoris | 6 (12%) | 20 (27%) | 0.07 |
| Stable angina pectoris | 43 (86%) | 53 (73%) |
⁎ One patient with both BMSs and DESs was excluded from Table 1 .
The angiographic findings during follow-up are summarized in Table 2 . No significant difference was seen in the location of the stents. In the qualitative comparative analysis, the reference diameter and minimum lumen diameter tended to be smaller in the BMSs than in the DESs. The restenotic lesion length was significantly longer in the BMSs. No significant difference was seen in diameter stenosis between the 2 groups.
| Variable | BMSs (n = 56) | DESs (n = 82) | p Value |
|---|---|---|---|
| Coronary location of stent | |||
| Right | 20 (36%) | 33 (40%) | |
| Left anterior descending | 26 (46%) | 34 (42%) | 0.83 |
| Circumflex | 10 (18%) | 15 (18%) | |
| Quantitative coronary angiogram analysis | |||
| Reference diameter (mm) | 2.79 ± 0.53 | 2.98 ± 0.62 | 0.06 |
| Minimum lumen diameter (mm) | 1.22 ± 0.48 | 1.41 ± 0.68 | 0.05 |
| Lesion length (mm) | 12.3 ± 5.6 | 10.2 ± 3.8 | 0.01 |
| Diameter stenosis (%) | 56.3 ± 13.0 | 53.2 ± 18.9 | 0.27 |
Of all 2,965 cross-sections of optical coherence tomographic images in 138 stents, 124 cross-sections (4.2%) were excluded from the analysis because of suboptimal image quality, and 2,841 cross-sections were analyzed. Quantitative tissue property analysis was performed in 1,464 cross-sections with a mean neointimal thickness >100 μm. The estimated inter- and intraobserver κ coefficient for the presence of lipid-laden plaque was 0.90 and 0.93, respectively, and the intraclass correlation coefficient for attenuation was 0.94 and 0.95, respectively.
The optical coherence tomographic findings are summarized in Table 3 . Of all 138 stents (56 BMSs and 82 DESs), 52 stents were in the early phase, 61 in the intermediate phase, and 25 in the delayed phase. In the early phase, a greater frequency of lipid-laden neointima and significantly greater %LRP were found in the DESs than in the BMSs. Neovascularization, especially in the peristrut area, was significantly more frequent in the BMSs than in DESs. No significant difference was seen in the other categorical values. The quantitative tissue property analysis did not show any significant differences between the BMSs and DESs. In the intermediate phase, the prevalence of lipid-laden neointima and the %LRP remained significantly greater in the DESs compared to the BMSs, but no significant difference was observed in macrophage infiltration, thin-cap fibroatheroma, disruption, or thrombus formation between the 2 groups. The tissue property analysis showed greater attenuation and NSD in the DESs, a finding consistent with the changes in neointima tissue characteristics. In the delayed phase, most stents showed lipid-laden neointima in both BMSs and DESs, and the %LRP tended to be greater in the BMSs. In the tissue property analysis, the signal attenuation was significantly greater in the BMSs than in the DESs.
| Parameter | Early phase | Intermediate phase | Delayed phase | ||||||
|---|---|---|---|---|---|---|---|---|---|
| BMS (n = 25) | DES (n = 27) | p Value | BMS (n = 18) | DES (n = 43) | p Value | BMS (n = 13) | DES (n = 12) | p Value | |
| Qualitative | |||||||||
| Lipid-laden intima | 2 (8%) | 10 (37%) | 0.02 | 5 (28%) | 27 (63%) | 0.03 | 10 (77%) | 9 (75%) | 0.99 |
| Percentage of lipid-rich plaque |
|
| 0.01 |
|
| <0.01 |
|
| 0.38 |
| Neovascularization | 20 (80%) | 6 (22%) | <0.01 | 10 (56%) | 15 (35%) | 0.23 | 9 (69%) | 9 (75%) | 0.99 |
| Intraintima | 7 (28%) | 2 (7%) | 0.07 | 7 (39%) | 11 (26%) | 0.36 | 9 (69%) | 7 (58%) | 0.69 |
| Peristrut | 18 (72%) | 5 (19%) | <0.01 | 9 (50%) | 11 (26%) | 0.08 | 7 (54%) | 5 (42%) | 0.70 |
| Macrophage | 0 (0%) | 2 (7%) | 0.49 | 2 (11%) | 2 (5%) | 0.57 | 9 (69%) | 4 (33%) | 0.12 |
| Thin cap fibroatheroma | 0 (0%) | 5 (19%) | 0.05 | 0 (0%) | 5 (12%) | 0.31 | 7 (54%) | 4 (33%) | 0.43 |
| Disruption | 0 (0%) | 3 (11%) | 0.24 | 1 (6%) | 5 (12%) | 0.66 | 4 (30%) | 1 (8%) | 0.32 |
| Thrombus | 0 (0%) | 3 (11%) | 0.24 | 1 (6%) | 5 (12%) | 0.66 | 2 (15%) | 1 (8%) | 0.99 |
| Quantitative | |||||||||
| Thinnest cap thickness (μm) | 104 ± 13 | 84 ± 30 | 0.30 | 102 ± 36 | 88 ± 33 | 0.41 | 57 ± 16 | 102 ± 52 | 0.03 |
| Attenuation | 0.65 ± 0.85 | 0.63 ± 1.95 | 0.96 | 0.65 ± 0.48 | 1.23 ± 1.53 | 0.03 | 2.82 ± 1.04 | 1.52 ± 1.56 | 0.02 |
| Backscatter | 6.33 ± 0.96 | 6.08 ± 0.69 | 0.29 | 6.46 ± 0.75 | 6.50 ± 0.57 | 0.86 | 6.28 ± 0.80 | 6.55 ± 0.74 | 0.40 |
| Normalized standard deviation | 0.144 ± 0.017 | 0.148 ± 0.016 | 0.35 | 0.141 ± 0.015 | 0.158 ± 0.018 | <0.01 | 0.160 ± 0.010 | 0.155 ± 0.011 | 0.28 |
The incidence of lipid-laden neointima and %LRP in the 3 phases are depicted in Figure 3 , and the interperiod comparison is summarized in Table 4 . In the BMS ( Table 4 ), the incidence of lipid-laden intima, %LRP, and tissue property values did not show a significant difference between the early and intermediate phases. However, the incidence of lipid-laden neointima, %LRP, attenuation, and NSD sharply increased between the intermediate and delayed phases and also became significantly greater in the delayed phase compared to the early and intermediate phases. In DESs ( Table 4 ), the incidence of lipid-laden intima and %LRP showed constant trends toward an increase over time. Neovascularization was significantly more frequent in the delayed phase compared to the early and intermediate phases. However, no significant difference was observed among the 3 phases in the BMSs.


Stay updated, free articles. Join our Telegram channel

Full access? Get Clinical Tree


