Postoperative delirium (PD) after transcatheter aortic valve implantation (TAVI) remains to be explored. We sought to (1) determine the incidence of PD in octogenarians who underwent TAVI or surgical aortic valve replacement (SAVR), (2) identify its risk factors, and (3) describe possible differences in the onset and course of PD between treatment groups. A prospective cohort study of consecutive patients aged ≥80 years with severe aortic stenosis who underwent elective TAVI or SAVR (N = 143) was conducted. The incidence of PD was assessed for 5 days using the Confusion Assessment Method (CAM). Risk factors for PD were studied with logistic regression. Patients treated with TAVI were older (p ≤0.001), had lower cognitive scores (p = 0.007), and more co-morbidities (p = 0.003). Despite this, significantly fewer (p = 0.013) patients treated with TAVI (44%) experienced PD compared to patients treated with SAVR (66%). Undergoing SAVR (p = 0.02) and having lower cognitive function (p = 0.03) emerged as risk factors for PD, whereas gender, activities of daily living, frailty, atrial fibrillation, and postoperative use of opioids and anxiolytics did not. Patients treated with TAVI and without PD during the first 2 postoperative days were unlikely to experience PD on subsequent days. The onset of PD after SAVR could occur at any time during the postoperative evaluation. In conclusion, SAVR in octogenarian patients with aortic stenosis might be considered as a predisposing factor for PD. Our data also suggest that the onset of PD was more unpredictable after SAVR.
Older patients undergoing cardiac surgery often develop postoperative delirium (PD). Transcatheter aortic valve implantation (TAVI) is offered to patients with aortic stenosis (AS) without reasonable surgical alternatives. Many TAVI patients are 80 years and older. Delirium, an acute and fluctuating change in cognition and attention, is often associated with adverse short- and long-term health implications. Although the cause of PD is not fully understood, it is known that impairment in cognition and activities of daily living (ADL), advanced age, co-morbidities, preoperative atrial fibrillation (AF), major surgery, and use of opioids and benzodiazepines are risk factors. The relation between PD and the patients’ status score in The American Society of Anesthesiologists (ASA) Physical Status Classification System, logistic EuroScore, and general anesthesia has been questioned. Frailty is a predictor of adverse health outcomes and death in the elderly, but whether frailty is also a risk factor for PD in octogenarian patients with AS remains to be established. Because TAVI is a less-invasive treatment currently offered to individuals with higher surgical risk, it is warranted to investigate if patients undergoing TAVI are less likely to develop PD. Knowledge about octogenarians undergoing invasive cardiovascular therapy is scarce. Although the incidence of PD after cardiac surgery has been explored, these studies included younger patients (<80 years) needing coronary artery bypass grafting (CABG) alone or combined with surgical aortic valve replacement (SAVR). Further predisposing factors can be identified by restricting the study population to octogenarians with severe AS who underwent elective treatment. A recent study described the incidence of PD after TAVI, studying only the first postoperative day and including few octogenarians. Therefore, the aims of this study were to (1) determine the incidence of PD in octogenarians with AS requiring SAVR or TAVI, (2) identify risk factors for its development, and (3) describe possible differences in the onset and course of PD in the 2 treatment groups.
Methods
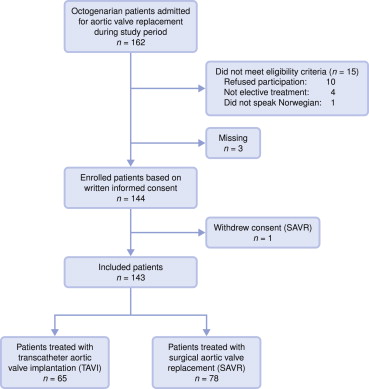
We conducted an observational, prospective cohort study of consecutive octogenarian patients who had undergone elective TAVI or SAVR in a tertiary university hospital in western Norway. Patients aged 80 years and older previously accepted for TAVI or SAVR were eligible. The study was entitled “Delirium in octogenarians undergoing cardiac surgery or intervention (CARDELIR)”, and presence of delirium was the primary outcome. A group of experts in cardiothoracic surgery and invasive cardiology evaluated octogenarian patients with AS and identified those not suitable for SAVR. Exclusion criteria were inability to speak and understand Norwegian and declining consent to participate. Severe AS was defined as aortic valve area <0.6 cm 2 /m 2 , mean gradient of >40 mm Hg, and maximum jet velocity >4.0 m/s. The main reasons disqualifying patients for standard SAVR included previous CABG, severe respiratory insufficiency, co-morbidities that could compromise recovery, and previous thoracic radiotherapy. From February 2011 to August 2013, 162 octogenarians were admitted for TAVI or SAVR. Of these, 147 fulfilled the eligibility criteria and 144 agreed to participate. One patient withdrew consent before surgery, and 7 were either not responsive or died within 5 days after treatment, leaving us with data for 136 patients ( Figures 1 and 2 ). One patient who underwent TAVI was discharged on the fourth postoperative day.
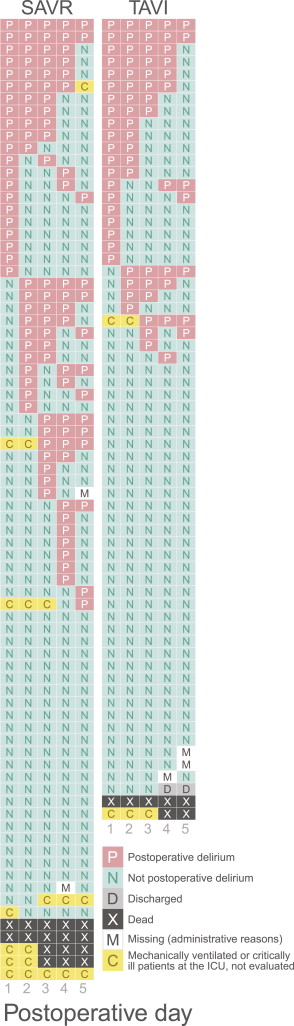
Assessment of the presence of PD was performed with the Confusion Assessment Method (CAM). CAM is based on operationalized criteria derived from the Diagnostic and Statistical Manual of Mental Disorders (DSM-IV) and assesses 4 features: (1) acute-onset and fluctuating course, (2) inattention, (3) disorganized thinking, and (4) altered level of consciousness. Delirium is diagnosed when features 1 and 2 are present and either 3 or 4 are displayed. The accuracy of CAM has been confirmed in several studies. We studied this primary outcome as the presence of PD on daily basis and as the presence of PD in a period of 5 days after AS treatment.
ADL function, atrial fibrillation, cognitive function, co-morbidity, and postoperative use of opioids and anxiolytics as potential risk factors for PD were selected on the basis of review of reports and clinical experience. Treatment with TAVI and baseline frailty were also included in the regression analysis. We assessed patient’s self-care abilities with the Barthel Index which evaluates ADL in 10 basic areas. This index is reliable and valid and provides a score from 0 to 20, with 19 or more indicating functional independence. General cognitive functioning was measured with the Mini-Mental State Examination (MMSE), a 20-item instrument, with maximum score of 30 points. Co-morbidities were quantified using the Charlson comorbidity index. It predicts mortality in patients with co-morbid disorders, assigning a score of 1, 2, 3, or 6, summed to predict mortality. Several studies have demonstrated the reliability and validity of the index. Frailty was defined using the Study of Osteoporotic Fractures (SOF) Frailty Index. It identifies subjects at risk of adverse health outcomes on the basis of weight loss, inability to rise from a chair 5 times without using his/her arms, and reduced energy level. The SOF Frailty Index classifies patients as robust, prefrail, or frail. Its psychometrical properties have been confirmed. We used patients’ medical records to identify the presence of preoperative atrial fibrillation, as assessed by a cardiologist, and to recognize postoperative use of opioids and anxiolytics.
Patients were approached for consent 1 day before intervention, and preoperative data were gathered that day. Demographic and clinical information was collected by interview or from medical records, as appropriate. ADL and cognitive function were measured at baseline, and data needed to score the SOF Frailty Index were collected at this time. Nursing staff were instructed about PD features regularly as reminders and were encouraged to report PD symptoms during every shift. However, research assistants trained to use the CAM were responsible for assessing PD after visiting the patients daily at noon, from postoperative days 1 to 5, including weekends. Patients were assessed for inattention, disorganized thinking, altered level of consciousness, and disorientation. Medical, nursing, and physiotherapist’ reports from the previous 24 hours and results from meetings with health professionals in charge of the study patients were also considered when CAM was scored.
The study was approved by the Regional Committee for Ethics in Medical Research (REK Vest 2010/2936-6) and conducted in accordance with the Declaration of Helsinki. Patients were invited to participate in the study after receiving oral and written information. Registered nurses with extensive experience with geriatric and cardiac patients, but not involved in the care of the patients, were responsible for enrollment and data collection. Because of patients’ advanced age and the nature of the procedure, we were particularly alert for verbal and nonverbal signs indicating displeasure or exhaustion during data collection.
Previous research on cardiac surgery populations and the primary outcome guided our power analysis. We determined a priori that 100 patients who underwent SAVR and 40 who underwent TAVI would be required to reach a statistical power of 80%, which would allow us to detect a reliable risk difference, given that 31% of patients in the SAVR group and 10% in the TAVI group actually developed delirium. Because the incidence of PD after TAVI had not been previously studied, the last percent was estimated. Two years after the start of the study, fewer eligible patients than we initially anticipated received SAVR. A new power analysis showed that including 84 patients who underwent SAVR and 65 patients who underwent TAVI would give a power of 89%.
Data are presented as counts and percentages or means and standard deviations. Differences between groups were tested with the chi-square or Fisher’s exact tests for categorical variables and the Welch t test (i.e., a t test not assuming equal variances) for continuous variables. Logistic regression was used to determine the impact of proposed risk factors on PD. A log-rank test for interval-censored data was used to study differences in the time to onset of delirium. Statistical analyses were performed using IBM SPSS Statistics for Windows, version 21.0 (IBM Corp., Armonk, NY), and R 3.0.2. (R Foundation for Statistical Computing, Vienna, Austria). A 2-tailed p value of ≤0.05 was considered statistically significant.
Results
Characteristics of the participants, stratified by the presence of delirium, are presented in Table 1 . Table 2 summarizes differences between patients in the TAVI and SAVR groups. TAVI was performed in 46% of the patients. General anesthesia was used in 48% of patients who underwent TAVI and in all patients who underwent SAVR (p ≤0.001). The mean length of stay in patients who underwent TAVI was 8.8 days (SD 6.0) versus 7.9 days (SD 4.7) after SAVR. The relatively long length of stay after TAVI was partly related to the general condition of the patients and to the risk of postoperative AV blockage and pacemaker requirement up to a week after CoreValve implantation.
| Variables | Total ( N =143) Mean or count | ±SD or (percent) | Non-delirium n =60 Mean or count | ±SD or (percent) | Delirium n =76 Mean or count | ±SD or (percent) | Univariate P-value |
|---|---|---|---|---|---|---|---|
| Age (years) | 83.5 | ±2.7 | 83.4 | ±2.8 | 83.5 | ±2.7 | 0.76 |
| Women | 81 | (57%) | 37 | (62%) | 39 | (51%) | 0.23 |
| Marital Status | 0.68 | ||||||
| Married | 77 | (54%) | 31 | (52%) | 42 | (55%) | |
| Cohabital status | 0.21 | ||||||
| Live alone | 67 | (47%) | 31 | (53%) | 31 | (41%) | |
| SOF Frailty Index | 0.36 | ||||||
| Robust | 48 | (34%) | 19 | (32%) | 27 | (36%) | |
| Prefrail | 39 | (27%) | 20 | (33%) | 17 | (22%) | |
| Frail | 56 | (39%) | 21 | (35%) | 32 | (42%) | |
| MMSE | 27.2 | ±2.9 | 27.6 | ±2.3 | 26.9 | ±3.3 | 0.14 |
| MMSE≤27 | 63 | (44%) | 24 | (40%) | 34 | (45%) | 0.58 |
| BI | 18.9 | ±1.5 | 19.2 | ±1.4 | 18.8 | ±1.5 | 0.11 |
| BI≤18 | 44 | (31%) | 16 | (27%) | 26 | (34%) | 0.34 |
| BMI (Kg/m 2 ) | 25.5 | ±4.1 | 25.4 | ±4.8 | 25.6 | ±3.8 | 0.72 |
| BMI (Kg/m 2 ) ≤20 | 13 | (9%) | 8 | (13%) | 5 | (7%) | 0.18 |
| Charlson Comorbidity Index | 2.1 | ±1.2 | 2.1 | ±1.2 | 2.1 | ±1.2 | 0.91 |
| Logistic EuroScore ∗ | 14.0 | (9.2%) | 15.4 | (9.3%) | 12.9 | (9.1%) | 0.11 |
| NYHA function class | 0.33 | ||||||
| I-II | 48 | (38%) | 19 | (34%) | 28 | (42%) | |
| III-IV | 80 | (62%) | 37 | (66%) | 38 | (58%) | |
| Left ventricle ejection fraction (%) | 56.4 | ±10.3 | 56.4 | ±11.1 | 56.6 | ±9.7 | 0.89 |
| Max aorta gradient (mmHg) | 79.3 | ±24.9 | 78.6 | ±25.5 | 79.4 | ±24.1 | 0.85 |
| Mean aorta gradient (mmHg) | 48.2 | ±16.6 | 48.0 | ±16.5 | 48.1 | ±16.5 | 0.99 |
| Aortic valve area (cm 2 /m 2 ) | 0.4 | ±0.2 | 0.4 | ±0.1 | 0.4 | ±0.2 | 0.30 |
| Preoperative atrial fibrillation | 39 | (27%) | 14 | (23%) | 25 | (33%) | 0.22 |
| Hemoglobin (g/dL) | 13.1 | ±1.4 | 13.0 | ±1.3 | 13.2 | ±1.5 | 0.25 |
| Creatinine concentration, (μmol) | 91.3 | ±27.8 | 88.6 | ±26.7 | 93.2 | ±26.9 | 0.32 |
| GFR, (mL/min/1.73m 2 ) | 54.8 | ±9.0 | 55.6 | ±8.6 | 54.5 | ±8.8 | 0.47 |
| Albumin, (g/L) | 44.0 | ±3.0 | 43.7 | ±2.9 | 44.2 | ±2.8 | 0.32 |
| Perioperative variables | |||||||
| Type treatment: TAVI | 65 | (45%) | 35 | (58%) | 25 | (42%) | 0.01 |
| ASA-Classification | 0.28 | ||||||
| III | 120 | (84%) | 48 | (80%) | 66 | (87%) | |
| IV | 23 | (16%) | 12 | (20%) | 10 | (13%) | |
| Anesthesia time (hours) | 3.9 | ±1.6 | 3.4 | ±1.3 | 4.1 | ±1.5 | 0.005 |
| Type of anesthesia (sedation) | 34 | (24%) | 20 | (33%) | 13 | (17%) | 0.03 |
| Preoperative medication | 0.02 | ||||||
| Oxazepam (Sobril) | 51 | (36%) | 29 | (49%) | 21 | (28%) | |
| Morfin scopolamine | 77 | (55%) | 24 | (41%) | 21 | (28%) | |
| None | 12 | (9%) | 6 | (10%) | 5 | (7%) | |
| Blood transfusion | 29 | (20%) | 8 | (13%) | 17 | (22%) | 0.18 |
| Hypotension | 75 | (52%) | 29 | (48%) | 41 | (54%) | 0.52 |
| Tachycardia | 8 | (6%) | 4 | (7%) | 4 | (5%) | 0.73 |
| Hypoxia † | 6 | (4%) | 0 | (0%) | 5 | (7%) | 0.07 |
| Post-operative medication | |||||||
| Opioids required | 117 | (83%) | 45 | (76%) | 67 | (88%) | 0.07 |
| Loop diuretics required | 127 | (89%) | 50 | (83%) | 73 | (96%) | 0.01 |
∗ P-value based on log-transformed values.
| Variables | Total ( N =143) Mean or count | ±SD or (percent) | TAVI n =65 Mean or count | ±SD or (percent) | SAVR n =78 Mean or count | ±SD or (percent) | Univariate p-value |
|---|---|---|---|---|---|---|---|
| Age (years) | 83.5 | ±2.7 | 84.8 | ±2.8 | 82.4 | ±2.0 | <0.001 |
| Female | 81 | (57%) | 41 | (63%) | 40 | (51%) | 0.16 |
| Marital Status | 0.18 | ||||||
| Married | 77 | (54%) | 31 | (48%) | 46 | (59%) | |
| Cohabital status | 0.13 | ||||||
| Live alone | 67 | (47%) | 35 | (54%) | 32 | (41%) | |
| SOF- Frailty Index | 0.11 | ||||||
| Robust | 48 | (34%) | 16 | (25%) | 32 | (41%) | |
| Prefrail | 39 | (27%) | 21 | (32%) | 18 | (23%) | |
| Frail | 56 | (27%) | 28 | (43%) | 28 | (36%) | |
| MMSE | 27.2 | ±2.9 | 26.5 | ±3.1 | 27.8 | ±2.6 | 0.007 |
| MMSE≤27 | 63 | (44%) | 36 | (55%) | 27 | (35%) | 0.01 |
| BI mean | 18.9 | ±1.5 | 18.8 | ±1.5 | 19.0 | ±1.5 | 0.37 |
| BI≤18 | 44 | (31%) | 23 | (35%) | 21 | (27%) | 0.27 |
| BMI (Kg/m 2 ) | 25.5 | ±4.1 | 25.0 | ±4.4 | 25.9 | ±3.9 | 0.20 |
| BMI≤20 | 13 | (9%) | 9 | (14%) | 4 | (5%) | 0.07 |
| Charlson Comorbidity index | 2.1 | ±1.2 | 2.5 | ±1.3 | 1.8 | ±1.0 | <0.001 |
| Logistic EuroScore ∗ | 14.0 | ±9.2 | 19.6 | ±10.6 | 9.4 | ±3.6 | <0.001 |
| NYHA function Class | <0.001 | ||||||
| I-II | 48 | (38%) | 11 | (20%) | 37 | (51%) | |
| III-IV | 80 | (62%) | 45 | (80%) | 35 | (49%) | |
| Left ventricle ejection fraction (%) | 56.4 | ±10.3 | 55.9 | ±10.1 | 56.8 | ±10.5 | 0.59 |
| Max aorta gradient (mmHg) | 79.3 | ±24.9 | 74.4 | ±23.8 | 83.6 | ±25.2 | 0.03 |
| Mean aorta gradient (mmHg) | 48.2 | ±16.6 | 45.6 | ±16.3 | 50.6 | ±16.7 | 0.08 |
| Aortic valve area (cm 2 /m 2 ) | 0.4 | ±0.2 | 0.4 | ±0.1 | 0.4 | ±0.2 | 0.64 |
| Preoperative atrial fibrillation | 39 | (27%) | 22 | (34%) | 17 | (22%) | 0.11 |
| Hemoglobin (g/dL) | 13.1 | ±1.4 | 12.7 | ±1.6 | 13.5 | ±0.12 | 0.001 |
| Creatinine concentration (μmol) | 91.3 | ±27.8 | 93.9 | ±28.1 | 89.2 | ±27.5 | 0.32 |
| Albumin, (g/L) | 44.0 | ±3.0 | 43.5 | ±3.0 | 44.4 | ±2.9 | 0.07 |
| Perioperative variables | |||||||
| ASA Classification | <0.001 | ||||||
| III | 120 | (84%) | 44 | (68%) | 76 | (97%) | |
| IV | 23 | (16%) | 21 | (32%) | 2 | (3%) | |
| Anesthesia time (hours) | 3.9 | ±1.6 | 2.8 | ±0.7 | 4.9 | ±1.5 | <0.001 |
| Preoperative medication | <0.001 | ||||||
| Oxazepam (Sobril) | 51 | (36%) | 50 | (81%) | 1 | (1%) | |
| Morfin scopolamine | 77 | (55%) | 0 | (0%) | 77 | (99%) | |
| None | 12 | (9%) | 12 | (19%) | 0 | (0%) | |
| Blood transfusion | 29 | (20%) | 6 | (9%) | 23 | (29%) | 0.003 |
| Tachycardia | 8 | (6%) | 4 | (6%) | 4 | (5%) | 0.79 |
| Hypoxia † | 6 | (4%) | 5 | (8%) | 1 | (1%) | 0.09 |
| Post-operative medication | |||||||
| Opioids required | 117 | (83%) | 40 | (62%) | 77 | (100%) | <0.001 |
| Loop diuretics required | 127 | (89%) | 51 | (78%) | 76 | (99%) | <0.001 |
Stay updated, free articles. Join our Telegram channel

Full access? Get Clinical Tree


