This study sought to compare the accuracy of 2-dimensional transesophageal echocardiography (TEE) and computed tomography angiography (CTA) for noninvasive aortic annular sizing as required for transcatheter aortic valve implantation (TAVI). Direct intraoperative (OR) sizing is the gold standard for aortic annular measurement in surgical aortic valve replacement. Unlike surgical aortic valve replacement, TAVI requires noninvasive assessment of aortic annular dimensions for determining the size of prosthesis to be implanted and controversy exists regarding the best imaging technique for TAVI sizing. Preoperative CTA and OR TEE images of the aortic annulus in 227 patients who underwent proximal aortic surgery with OR annular sizing at the Duke University Medical Center were reviewed. Both imaging techniques were compared with direct OR measurements of aortic annulus diameter using metric sizers as the gold standard. CTA overestimated aortic annulus diameter in 72.2% of cases, with 46.3% >1 TAVI valve-size (>3 mm) overestimations, whereas TEE underestimated aortic annulus diameter in 51.1% of cases, with 16.7% >1 valve-size underestimations. Combining both techniques improved the estimation of aortic annular size. In conclusion, there are limitations to current imaging techniques for noninvasive determination of aortic annular dimensions compared with direct OR sizing. Undersizing by TEE and oversizing by CTA are common and may be related to differences in methods for sizing an elliptical structure. Combining measurements from both techniques would decrease the false exclusion rate for TAVI eligibility because of size mismatch.
Since its first introduction in 2002, transcatheter aortic valve implantation (TAVI) has continued to gain popularity and acceptance as an alternative to surgical aortic valve replacement (SAVR). The aortic annulus, defined as the virtual ring with 3 anchors at the nadir of the attachments of each aortic cusp, is a complex 3-dimensional (3D) structure. Although direct intraoperative (OR) sizing is the gold standard for aortic annular measurement in SAVR, it is not obtainable in TAVI. Therefore, noninvasive assessment of aortic annular dimensions using various imaging techniques is crucial for proper device selection in TAVI. Underestimation of size could lead to implantation of a prosthesis that is too small with subsequent device migration or paravalvular leak, whereas overestimation could lead to a larger device being implanted causing device infolding or annular rupture. Many imaging techniques are currently used for annular assessment, including transthoracic echocardiography, transesophageal echocardiography (TEE), and electrocardiography (ECG)-gated computed tomography (CT). However, the optimal imaging technique remains controversial, generally owing to the lack of a gold standard for comparison. As such, comparison of aortic annulus size by TEE versus CT with direct surgical measurement, as performed in SAVR, could offer insight into the optimal imaging technique for preoperative TAVI planning. In this study, we sought to compare the accuracy of 2-dimensional (2D) TEE and computed tomography angiography (CTA) for aortic annular sizing.
Methods
The study population consisted of 227 consecutive patients who underwent proximal aortic surgery (SAVR, aortic root, or ascending aorta ± SAVR) by a single surgeon at the Duke University Medical Center (Durham, North Carolina) from 2005 to 2012, all of whom had preoperative aortic CTA imaging, OR TEE imaging, and direct OR measurement of the aortic annulus in the arrested heart using standard metric sizers. All preoperative and OR variables were obtained from the Duke Thoracic Aortic Surgery Database, a prospectively maintained clinical registry of all patients who underwent thoracic aortic surgery at the Duke University Medical Center. After review and approval by the Institutional Review Board of the Duke University, the need for individual patient consent was waived.
OR TEE was performed in all patients in this study. The aortic annulus was measured in the mid-esophageal long-axis view at approximately 120° during end-systole ( Figure 1 ). Two experienced cardiologists blinded to the study data reviewed all images retrospectively and provided the TEE measurements.
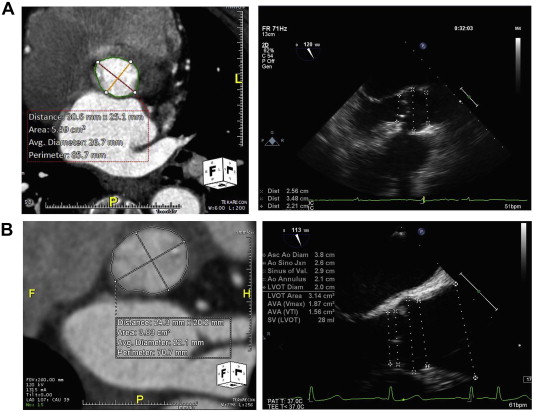
All patients underwent aortic CTA imaging as part of preoperative planning for their surgical repair. Four types of CT acquisition schemes were used: ECG-gated, non–ECG-gated dual-source 64 MDCT scanner, non–ECG-gated single-source 64 MDCT scanner, and non–ECG-gated 16 or lower single-source MDCT scanner. A radiologist specializing in chest and cardiac imaging blinded to the study data and analyzed all images retrospectively using the TeraRecon software (TeraRecon, Inc., Foster City, California). True cross-sectional measurements along the major and minor axis were obtained ( Figure 1 ). The effective diameter was calculated using the equation for the area of a circle (A = π × r 2 ) and used as the CTA measurement. For images acquired using an ECG-gated scheme, measurements were obtained during systole or point of least cardiac motion. Measurements for all cases were averaged independent of the type of CT acquisition scheme.
Direct surgical measurement of the aortic annulus was obtained on the arrested heart at the time of proximal aortic surgery in all patients. All cases were performed through median sternotomy and 93.8% (n = 213) involved proximal aortic repair (aortic root or ascending aorta ± SAVR) with the remaining 6.2% being isolated SAVR. The aortic valve pathologies consisted of 15.4% aortic stenosis (n = 35), 52.4% (n = 119) aortic insufficiency, 23.8% (n = 54) mixed aortic stenosis and insufficiency, and 8.4% (n = 19) normal aortic valves. The aortic annulus was measured by a single surgeon blinded to the CTA and TEE annular measurements using standard metric sizers.
Statistical analysis was conducted using the SAS statistical package, version 9.2 (SAS Institute, Cary, North Carolina) and R software, version 3.0 (R Foundation for Statistical Computing, Vienna, Austria). Normality of distributions for continuous variables was tested using the Shapiro-Wilks test. Paired t test was used to analyze normally distributed variables and Wilcoxon signed-rank test was used for non-normally distributed variables. Spearman correlation and linear regression were used to model relations between different sizing techniques. K-fold cross-validation and an analysis of variance test were used to compare different models.
Results
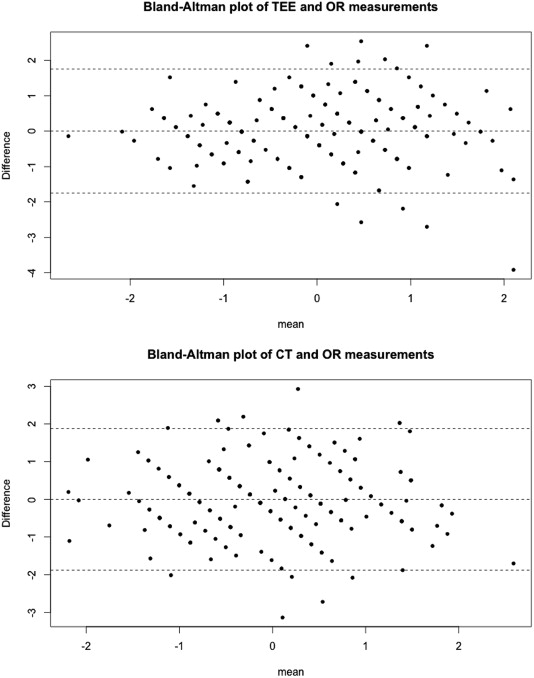
The mean maximum annular diameter on CTA was 28.4 ± 4.6 mm, and the minimum diameter was 22.4 ± 4.0 mm. The annular perimeter and area on CTA were 88.9 ± 14.2 mm and 644.2 ± 206.6 mm 2 , respectively. The mean eccentricity index, defined as (1 – short-axis diameter/long-axis diameter) on CT, was 0.2 ± 0.1. Comparison of direct OR, CTA, and TEE measurements of aortic annular diameter is illustrated in Table 1 and Figure 2 .
| Modality | Mean ± SD (mm) | UE (%) | > 3 mm or 1 TAVI valve-size UE (%) | OE (%) | > 3 mm or 1 TAVI valve-size OE (%) | Correct estimation (%) |
|---|---|---|---|---|---|---|
| OR | 25.6 ± 3.1 | — | — | — | — | — |
| CTA | 28.4 ± 4.5 | 44 (19.4%) | 15 (6.6%) | 164 (72.2%) | 105 (46.3%) | 19 (8.4%) |
| TEE | 25.1 ± 3.9 | 116 (51.1%) | 38 (16.7%) | 79 (34.8%) | 27 (11.9%) | 32 (14.1%) |
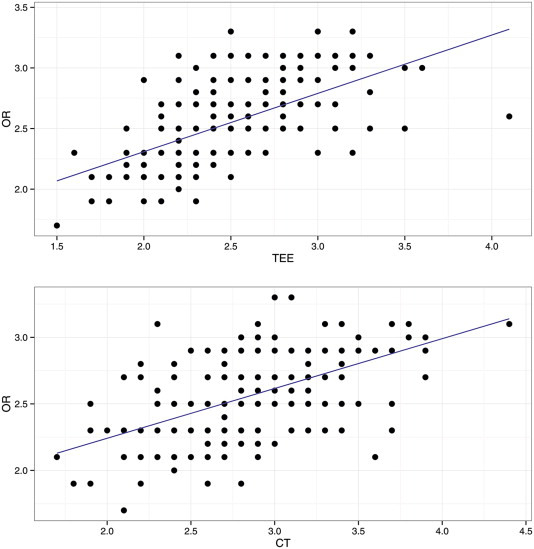
Sizing by TEE and CTA both correlated with direct OR measurement with correlation coefficients of 0.62 and 0.53, respectively. The correlation coefficient for TEE and CTA measurement was 0.35. Linear regression modeling OR size with TEE and CTA measurements revealed that OR size = 1.004 × TEE measurement and 0.887 × CTA measurement with R 2 of 0.98 and 0.98, respectively (p <0.001, Figure 3 ). A multipredictor model using both TEE and CTA measurements indicated that OR size = 0.55 × TEE measurement + 0.41 × CTA measurement (p <0.001, R 2 = 0.99). K-fold cross-validation (k = 3) using all 3 linear models was performed. The data were split into 3 equal-sized parts at random, and models were fit to 2 parts of the data. The prediction error of the fitted model when predicting the third part was calculated. The 2 models using TEE and CTA showed comparable results with overall mean squared error of 0.107 and 0.125, respectively, whereas the combined model using both TEE and CTA had the lowest overall mean squared error of 0.06. Analysis of variance test comparing 3 models also showed an improvement in the estimation of aortic annular size using the combined model (p <0.001).
Subgroup analysis by CT type did not reveal any significant differences between the 4 different CT acquisition schemes in their deviance from OR measurement (p = 0.48, Table 2 ). Subgroup analysis by CT slice thickness also indicated no difference between slice thickness and deviance from OR measurement (p = 0.54, Table 3 ). The results of subgroup analysis comparing bicuspid aortic valve (BAV, n = 89) to trileaflet aortic valve (TAV, n = 138) are listed in Table 4 .
| CT type | N (%) | Mean difference from OR measurement ± SD (mm) |
|---|---|---|
| ECG-gated | 22 (10.1%) | 3.8 ± 2.8 |
| DSCT | 28 (12.8%) | 4.5 ± 2.5 |
| SSCT | 112 (51.4%) | 3.7 ± 2.8 |
| 16 or lower | 54 (24.8%) | 3.6 ± 2.7 |
| CT slice thickness (mm) | N | Mean difference from OR measurement ± SD (mm) |
|---|---|---|
| < 1.0 | 20 (9.1%) | 3.7 ± 2.8 |
| 1.0–1.5 | 161 (73.5%) | 3.7 ± 2.7 |
| 1.6–4.9 | 38 (17.4%) | 4.1 ± 2.1 |
Stay updated, free articles. Join our Telegram channel

Full access? Get Clinical Tree


