A paucity of published data evaluating the outcomes of older patients (age ≥70 years) undergoing revascularization for unprotected left main coronary artery disease is available. We performed aggregate data meta-analyses of the clinical outcomes (all-cause mortality, nonfatal myocardial infarction, stroke, repeat revascularization, and major adverse cardiac and cerebrovascular events at 30 days and 12 and 22 months) in studies comparing percutaneous coronary intervention (PCI) and coronary artery bypass grafting (CABG) in patients with a mean age of ≥70 years and unprotected left main coronary artery disease. A comprehensive, time-unlimited literature search to January 31, 2013 identified 10 studies with a total of 2,386 patients (PCI, n = 909; CABG, n = 1,477). Summary odds ratios (ORs) and 95% confidence intervals (CIs) were estimated using the random-effects model. The patients in the PCI group were more likely than those in the CABG group to present with acute coronary syndrome (59.6% vs 44.8%, p <0.001). PCI was associated with a shorter hospital stay (4.2 ± 0.8 vs 8.3 ± 0.01 days, p <0.001). No significant differences were found between PCI and CABG for all cause-mortality, nonfatal myocardial infarction, and major adverse cardiac and cerebrovascular events at 30 days and 12 and 22 months. However, PCI was associated with lower rates of stroke at 30 days (OR 0.14, 95% CI 0.02 to 0.76) and 12 months (OR 0.14, 95% CI 0.03 to 0.60) and higher rates of repeat revascularization at 22 months (OR 4.34, 95% CI 2.69 to 7.01). These findings were consistent with the findings from a subgroup analysis of patients aged ≥75 years. In conclusion, older patients (age ≥70 years) with unprotected left main coronary artery disease had comparable rates of all-cause mortality, nonfatal myocardial infarction, and major adverse cardiac and cerebrovascular events after PCI or CABG. The patients undergoing PCI had a shorter hospital stay and lower rates of early stroke; however, they experienced higher repeat revascularization rates at longer term follow-up.
A recent analysis of surgical outcomes after coronary artery bypass grafting (CABG) in older patients (age ≥75 years) showed no effect of age on surgical mortality. However, it reported an overall lower risk profile for patients undergoing CABG during the previous 2 decades (i.e., decline in the prevalence of poor left ventricular function, urgency of surgery, and redo CABG), which might represent a trend toward the selection of lower risk patients for CABG. In the recent American College of Cardiology Foundation/American Heart Association/Society for Cardiovascular Angiography and Interventions and European Society of Cardiology/European Association for Cardio-Thoracic Surgery guidelines for PCI, PCI for unprotected left main coronary artery disease (LMCAD) was upgraded from class III to class IIa and IIb recommendation levels for selected patients. These changes in the practice guidelines are likely to be followed by an increase in the use of PCI for patients with unprotected LMCAD, including older patients (age ≥70 years), who are more likely to be deemed at high risk for CABG. Given the limited evidence for these patients on the risks and benefits of PCI and CABG for unprotected LMCAD, we conducted a meta-analysis of all comparative studies available in the published data of this high-risk cohort.
Methods
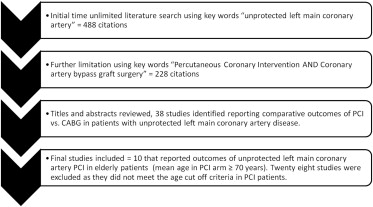
We performed a systematic, time-unlimited, data search to identify relevant studies to January 31, 2013 in MEDLINE (PubMed) and ClinicalTrials.gov . We only included reports published in peer-reviewed and indexed medical journals. The initial search using the keyword “unprotected left main coronary artery” identified 488 citations. Additional limits were applied to refine the initial search using the keywords “percutaneous coronary intervention” AND “coronary artery bypass graft” ( Figure 1 ). After a careful review of the abstracts of these citations, 38 comparative studies examining the outcomes of patients with unprotected LMCAD who had undergone surgical versus percutaneous revascularization were identified. The studies were included in the present meta-analysis if the mean age of the patients in the PCI and CABG groups were ≥70 years of age. Using this criterion, 28 of these studies were subsequently excluded. The final systematic analysis included 10 studies comparing PCI and CABG for unprotected LMCAD in patients with mean age of ≥70 years.
Each of these 10 studies ( Table 1 ) was thoroughly reviewed, and the data were extracted independently by 3 reviewers (S.A.S., K.H.S., and S.S.). Data on the baseline sociodemographic and clinical variables, variables pertaining to the clinical presentation, risk stratification scores (additive European System for Cardiac Operative Risk Evaluation [EuroSCORE], Parsonnet score, SYNTAX score), coronary anatomy, and procedural variables were collected ( Table 2 ). The initial revascularization strategy (PCI or CABG) was the primary independent variable. The co-primary outcomes included all-cause mortality. The secondary outcomes included major adverse cardiac and cardiovascular events (MACCE; composite end point of all-cause mortality, nonfatal myocardial infarction [MI], stroke, or repeat revascularization) and the individual outcomes of all-cause death, MI, nonfatal stroke, and repeat revascularization. The outcomes were reported at 30-day, 12-month, and 22-month weighted mean follow-up in a cumulative fashion. We used the studies’ defined end points to conduct our meta-analyses.
| Authors | Year | Study Design | DES (%) | PCI (n) | CABG (n) | Region | Mean Follow-Up (mo) | BMS (n) |
|---|---|---|---|---|---|---|---|---|
| Capodanno et al | 2012 | Prospective registry | 100 | 84 | 118 | Europe | 12 | 0 |
| Rittger et al | 2011 | Prospective registry | 100 | 39 | 37 | Europe | 12 | 0 |
| Shimizu et al | 2010 | Retrospective study | 100 | 64 | 89 | Asia | 36 | 0 |
| Ghenim et al | 2009 | Retrospective cohort (propensity adjusted) | 100 | 105 | 106 | Europe | 12 | 0 |
| Liu et al | 2009 | Retrospective cohort | 100 | 89 | 206 | Asia | 25 | 0 |
| Mäkikallio et al | 2008 | Prospective registry | 100 | 49 | 238 | Europe | 12 | 0 |
| White et al | 2008 | Retrospective study (propensity adjusted) | 100 | 120 | 223 | US | 30 | 0 |
| Rodés-Cabau et al | 2008 | Retrospective study | 48 | 104 | 145 | Canada | 23 | 54 |
| Palmerini et al | 2007 | Retrospective study | 100 | 98 | 161 | Europe | 24 | 0 |
| Palmerini et al | 2006 | Prospective registry (Bologna registry) | 60 | 157 | 154 | Europe | 24 | 63 |
| Total | 909 | 1,477 | 117 |
| Variable | PCI | CABG | p Value | ||
|---|---|---|---|---|---|
| Patients (n) | Value | Patients (n) | Value | ||
| Total patients | 909 | 1,477 | NA | ||
| Total follow-up (patient-yrs) | 909 | 1,656.3 | 1,477 | 2,643.4 | 0.102 |
| Average follow-up (mo) | 909 | 21.9 | 1,477 | 21.5 | 0.110 |
| Mean age (yrs) | 820 | 76.9 ± 5.7 | 1,271 | 74.0 ± 5.6 | 0.463 |
| Men | 820 | 513 (62.6) | 1,271 | 903 (71.0) | <0.001 |
| Mean LVEF (%) | 651 | 51.9 ± 2.2 | 1,076 | 52.7 ± 2.6 | 0.981 |
| Patients aged ≥75 yrs | 430 | 567 | |||
| Mean age ≥75 yrs | 430 | 81.5 ± 2.0 | 567 | 79.5 ± 1.6 | 0.196 |
| Silent myocardial ischemia | 261 | 12 (4.6) | 299 | 29 (9.7) | 0.0371 |
| Stable angina pectoris | 465 | 109 (23.4) | 522 | 211 (40.4) | <0.001 |
| ACS (USA/NSTEMI) | 821 | 489 (59.6) | 996 | 446 (44.8) | <0.001 |
| STEMI | 84 | 5 (6.0) | 118 | 9 (7.6) | 0.782 |
| Mean EuroSCORE, additive | 700 | 6.2 ± 2.0 | 1,048 | 5.7 ± 1.7 | 0.19 |
| Mean Parsonnet score | 414 | 17.6 ± 5.0 | 575 | 12.9 ± 2.3 | 0.96 |
| SYNTAX score | 84 | 26.3 ± 10.2 | 118 | 36.4 ± 12.3 | NA |
| Diabetes mellitus | 820 | 256 (31.2) | 1,271 | 350 (27.5) | 0.076 |
| Hypertension | 820 | 608 (74.1) | 1,271 | 880 (69.2) | 0.016 |
| Hyperlipidemia ∗ | 771 | 460 (59.7) | 1,033 | 688 (66.6) | 0.003 |
| Smoker | 781 | 240 (30.7) | 1,234 | 345 (28.0) | 0.190 |
| Known CAD † | 169 | 68 (40.2) | 195 | 55 (28.2) | 0.019 |
| Previous MI | 553 | 168 (30.4) | 649 | 231 (35.6) | 0.057 |
| Previous PCI | 602 | 136 (22.6) | 887 | 105 (11.8) | <0.001 |
| Chronic renal insufficiency | 732 | 104 (14.2) | 996 | 101 (10.1) | 0.011 |
| Previous stroke | 543 | 45 (8.3) | 772 | 56 (7.2) | 0.528 |
| Previous CHF | 305 | 116 (38.0) | 361 | 116 (32.1) | 0.121 |
| Peripheral arterial disease | 507 | 138 (27.2) | 667 | 175 (26.2) | 0.739 |
| Distal LMCAD | 756 | 549 (72.6) | 539 | 410 (76.2) | 0.157 |
| Nondistal LMCAD | 756 | 207 (27.4) | 539 | 129 (23.8) | 0.157 |
| Isolated LMCAD | 514 | 52 (10.1%) | 467 | 11 (2.3) | <0.001 |
| LMCA with single-vessel CAD | 514 | 199 (38.7) | 467 | 67 (14.3) | <0.001 |
| LMCA with two-vessel CAD | 514 | 138 (26.8) | 467 | 118 (25.2) | 0.611 |
| LMCA with triple-vessel CAD | 612 | 203 (33.2) | 628 | 390 (62.1) | <0.001 |
| Hospital stay (days) | 329 | 4.2 ± 0.8 | 474 | 8.3 ± 1.6 | <0.001 |
| Paclitaxel-eluting stent | 550 | 246 (44.7) | NA | NA | NA |
| Sirolimus-eluting stent | 550 | 187 (34.0) | NA | NA | NA |
| Bare metal stent | 909 | 117 (12.1) | NA | NA | NA |
| IMA–LAD graft | NA | NA | 878 | 823 (93.7%) | NA |
| Off-pump CABG | NA | NA | 1,116 | 265 (23.7%) | NA |
∗ As defined in the individual studies.
† As defined and/or determined by the individual investigators.
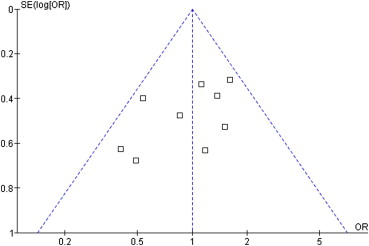
The percentages and mean ± SD were calculated to describe the distributions of categorical and continuous variables, respectively. Continuous variables were compared using the 2-tailed, independent-samples Student t test. Categorical variables were compared using the chi-square test with Yates’ correction, where applicable. Odds ratios (ORs) and their 95% confidence intervals (CIs) were used to summarize the effect size for each clinical outcome at the corresponding follow-up using the random-effects model. Measures of heterogeneity, including Cochran’s Q-statistic and I 2 index tests, were computed. An I 2 index of ≥25% was considered to indicate significant heterogeneity. Publication bias was assessed using the funnel plot analysis as shown in Figure 2 . We report the results from the random-effects modeling only, given the variable degrees of data heterogeneity, as shown statistically, and given the inherent heterogeneity in any systematic review of studies from the published data. p Values ≤0.05 were considered statistically significant. The baseline data were analyzed using the Statistical Package for Social Sciences, version 19.0 (IBM, Armonk, New York). The meta-analyses were performed using Review Manager, version 5.0 (Copenhagen: The Nordic Cochrane Center, The Cochrane Collaboration 2012).
Results
The current meta-analysis included a total of 10 comparative studies enrolling 2,386 patients (PCI, n = 909; CABG, n = 1,477). A funnel plot for all-cause mortality was constructed and showed a near-symmetric distribution of the effect sizes of all individual studies ( Figure 2 ), indicating the absence of a significant publication bias. Significant differences were found in the baseline clinical profiles of the patients undergoing PCI and CABG ( Table 2 ). The patients in the PCI group had a higher prevalence of co-morbid conditions, including hypertension, known coronary artery disease, previous PCI, and chronic kidney disease, and were more likely to present with acute coronary syndrome (59.6% vs 44.8%, p <0.001) than patients in the CABG group. In addition, the patients in the PCI group were less likely to be men and had a lower prevalence of hyperlipidemia than the CABG group. The 2 groups of patients had a comparable mean age and left ventricular ejection fraction. The 2 groups also had a similar distribution of LMCAD (i.e., distal vs nondistal). However, a higher proportion of patients with isolated LMCAD or LMCAD with single-vessel disease underwent PCI, and a greater proportion of patients with LMCAD and triple-vessel disease underwent CABG ( Table 2 ). Paclitaxel- and sirolimus-eluting stents were the predominant stent types implanted in the PCI group (44.7% and 34.0% of patients, respectively). Notably, 117 patients (12.1%) had received bare metal stents. Most patients who underwent CABG received an internal thoracic artery graft (93.7%), and 23.7% underwent off-pump CABG ( Table 2 ).
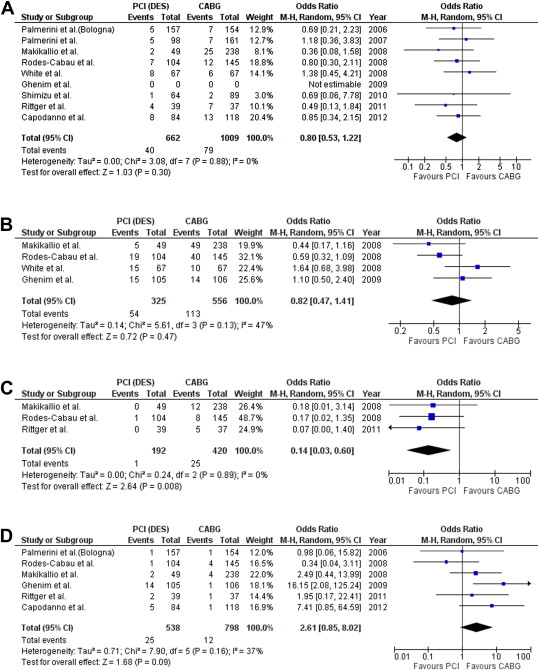
Patients undergoing PCI for unprotected LMCAD had a shorter hospital stay than their CABG counterparts (4.2 ± 0.8 vs 8.3 ± 1.6 days, p <0.001). No intergroup differences were found between the PCI and CABG groups for the primary outcome of all-cause mortality at 30 days (OR 0.72, 95% CI 0.41 to 1.26), 12 months (OR 0.80, 95% CI 0.53 to 1.22), and 22 months (OR 1.00, 95% CI 0.73 to 1.38) of follow-up. Regarding the secondary outcomes, the PCI and CABG groups had comparable odds of 30-day MI, repeat revascularization, and MACCE ( Table 3 ). However, the patients in the PCI group had a lower stroke rate at 30 days (OR 0.14, 95% CI 0.02 to 0.76). Compared with CABG, PCI was associated with comparable 12-month rates of MI, repeat revascularization, and MACCE but lower rates of stroke (OR 0.14, 95% CI 0.03 to 0.60). At a weighted mean follow-up of 22 months (range 12 to 36), no intergroup differences were found in the rates of MI, stroke, and MACCE between the PCI and CABG groups ( Table 3 ). However, PCI for unprotected LMCAD was associated with higher rates of repeat revascularization (OR 4.34, 95% CI 2.69 to 7.01; Table 3 ). Figure 3 provides forest plots comparing the 12-month ORs of all-cause death, MACCE, nonfatal stroke, and repeat revascularization.
| Outcome | Studies ∗ (n) | Patients † (n) | Event Rate | OR (Random) (95% CI) | Q | p Value | I 2 | τ 2 | |
|---|---|---|---|---|---|---|---|---|---|
| PCI | CABG | ||||||||
| Death | |||||||||
| 30 days | 6 | 1,335 | 20/511 (3.91) | 47/824 (5.70) | 0.72 (0.41–1.26) | 2.52 | 0.77 | 00.00 | 0.00 |
| 12 mo | 8 | 1,671 | 40/662 (6.04) | 79/1,009 (7.83) | 0.80 (0.53–1.22) | 3.08 | 0.88 | 00.00 | 0.00 |
| 22 mo | 9 | 1,966 | 97/751 (10.6) | 158/1,215 (13.00) | 1.00 (0.73–1.38) | 9.47 | 0.30 | 16.00 | 0.04 |
| MACCE ‡ | |||||||||
| 30 days | 2 | 460 | 23/209 (11.00) | 46/251 (18.32) | 0.60 (0.34–1.05) | 0.03 | 0.87 | 00.00 | 0.00 |
| 12 mo | 4 | 881 | 54/325 (16.61) | 113/556 (20.32) | 0.82 (0.47–1.41) | 5.61 | 0.13 | 47.00 | 0.14 |
| 22 mo | 5 | 1,034 | 102/389 (26.22) | 141/645 (21.86) | 1.27 (0.81–1.98) | 6.97 | 0.14 | 43.00 | 0.11 |
| Stroke | |||||||||
| 30 days | 2 | 325 | 1/143 (0.69) | 12/182 (6.59) | 0.14 (0.02–0.76) | 0.09 | 0.76 | 0.00 | 0.00 |
| 12 mo | 3 | 612 | 1/192 (0.52) | 25/420 (5.95) | 0.14 (0.03–0.60) | 0.24 | 0.89 | 0.00 | 0.00 |
| 22 mo | 4 | 765 | 9/256 (3.51) | 27/509 (5.30) | 0.46 (0.10–2.18) | 5.52 | 0.14 | 46.00 | 1.16 |
| Revascularization | |||||||||
| 30 days | 4 | 847 | 2/405 (0.49) | 5/442 (1.13) | 0.51 (0.09–2.89) | 0.34 | 0.56 | 00.00 | 0.00 |
| 12 mo | 6 | 1,336 | 25/538 (4.64) | 12/798 (1.50) | 2.61 (0.85–8.02) | 7.90 | 0.16 | 37.00 | 0.71 |
| 22 mo | 9 | 2,043 | 122/789 (15.46) | 44/1,254 (3.50) | 4.34 (2.69–7.01) | 10.98 | 0.20 | 27.00 | 0.14 |
| Nonfatal MI | |||||||||
| 30 days | 4 | 895 | 25/398 (6.28) | 31/497 (6.24) | 1.22 (0.56–2.64) | 3.97 | 0.27 | 24.00 | 0.16 |
| 12 mo | 7 | 1,595 | 40/636 (6.29) | 38/959 (3.96) | 1.70 (0.75–3.85) | 10.88 | 0.09 | 45.00 | 0.49 |
| 22 mo | 9 | 2,043 | 61/789 (7.73) | 68/1,254 (5.42) | 1.31 (0.78–2.21) | 10.54 | 0.23 | 24.00 | 0.14 |
∗ Studies reporting the outcome.
‡ Composite end point of death, nonfatal MI, stroke, and repeat revascularization.
Two subgroup analyses were also performed. The first subgroup analysis was performed to evaluate the clinical outcomes in patients aged ≥75 years. The overall results of this subgroup analysis, including a total of 997 patients, are listed in Table 4 . A second subgroup analysis after exclusion of propensity matched studies was performed ( Table 5 ). The outcomes of these 2 sensitivity analyses were consistent with those from our main analysis.


