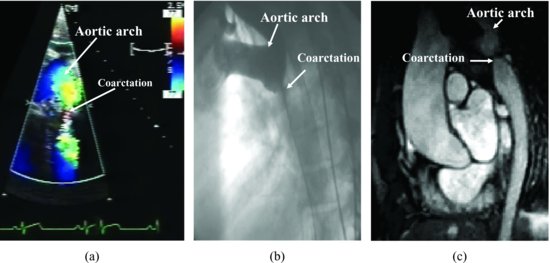
Figure 49.2 Transthoracic echocardiography: suprasternal view shows a discrete area of narrowing within the lumen of the thoracic aorta. Color Doppler image shows turbulence in the arch due to the coarctation (a). Aortic angiogram shows coarctation of thoracic aorta (b). Magnetic resonance imaging shows coarctation of thoracic aorta (c). Three different cardiac images are comparable.
Continuous wave Doppler determines the severity by obtaining maximal flow velocities across the narrowed area and calculating the pressure gradient (56 mmHg) across the coarctation (Figure 49.3). This patient also has a bicuspid aortic valve as demonstrated by transesophageal echocardiography at angle 62° (Figure 49.4). Electrocardiogram: normal sinus rhythm with evidence of LVH. Chest X-ray results: (1) rib notching; (2) normal cardiopericardial silhouette; and (3) normal lung fields.
Figure 49.3 Continuous wave Doppler determines the severity by obtaining maximal flow velocities across the narrowed area and calculating the pressure gradient (56 mmHg) across the coarctation.
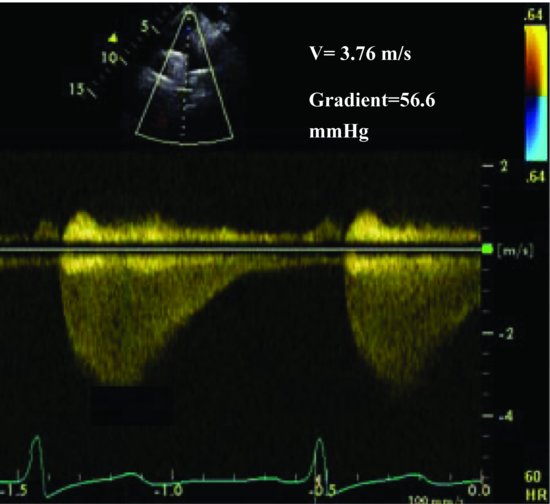
Figure 49.4 This patient also has a bicuspid aortic valve demonstrated by transesophageal echocardiography at an angle of 62°.

Stay updated, free articles. Join our Telegram channel

Full access? Get Clinical Tree


