Unstable angina pectoris (UAP) is categorized with the Braunwald classification. However, the association of clinical presentation and plaque structure/function has not yet been elucidated in relation to cause. We used optical coherence tomography to investigate this relation. One hundred fifteen patients with primary UAP were categorized according to the Braunwald classification. Patients with class I UAP had the highest frequency of ulcers without fibrous cap disruption (p = 0.003) and the smallest minimum lumen area (class I, median 0.70 mm 2 , quartiles 1 to 3 0.42 to 1.00; class II, 1.80 mm 2 , 1.50 to 2.50; class III, 2.31 mm 2 , 1.21 to 3.00; p <0.001). Patients with class II UAP had the highest frequency of coronary spasm (p <0.001) and the lowest frequency of thrombi (p <0.001). Patients with class III UAP had the highest frequency of plaque ruptures (p <0.001), the thinnest fibrous cap (class I, median 140 μm, quartile 1 to 3 90 to 160; class II, 150 μm, 120 to 160; class III, 60 μm, 40 to 105; p <0.001), and the highest frequency of thin cap fibroatheromas (p <0.001) and spotty calcifications (p <0.001). In conclusion, the structures/functions of culprit lesions on optical coherence tomograms differ in the Braunwald classes of UAP. Plaque vulnerability, progressive stenosis, and vasoconstriction may be related to the cause of the distinct presentations.
Intravascular optical coherence tomography (OCT) has been used as a high-resolution imaging technique for plaque characterization. OCT is an optical analog of intravascular ultrasound, with a resolution of approximately 10 to 20 μm. Histologic studies have shown that OCT has the capability to reveal the various microstructures of an atherosclerotic plaque, including thin cap fibroatheroma, lipid core, and thrombus. In acute myocardial infarction, OCT has revealed the structure/function of the culprit lesion in detail. The aims of this study were to analyze plaque characteristics for each clinical classification of unstable angina pectoris (UAP) using OCT and to clarify the relation between clinical presentation and plaque structure/function in various types of UAP.
Methods
From January 2008 to June 2009, 118 consecutive patients with primary UAP who underwent coronary angiography were enrolled in this study. Patients were categorized into 3 groups according to the Braunwald clinical classification: class I (new onset of severe angina or accelerated angina, no pain at rest, n = 49), class II (angina at rest within previous month but not within preceding 48 hours, n = 30), and class III (angina at rest within 48 hours, n = 40). Patients with secondary UAP and postinfarction angina were not included. Exclusion criteria from optical coherence tomographic examination were presence of congestive heart failure, history of myocardial infarction, and cardiogenic shock.
Demographic and clinical data were collected prospectively. The study protocol was approved by the ethics committee of Wakayama Medical University, and all patients provided informed consent before participation. The study was conducted in compliance with the Declaration of Helsinki.
Oral aspirin (162 mg) and intravenous heparin (100 U/kg) were administered before coronary catheterization. Patients did not receive any thrombolytic therapy before angioplasty. Coronary catheterization was performed by the conventional femoral approach using 6-F sheaths and catheters. The culprit lesion was identified by the findings of coronary angiogram and those of electrocardiogram and transthoracic echocardiogram. If coronary angiogram showed no significant organic stenosis, a provocation test using acetylcholine was conducted. Acetylcholine was injected in incremental doses into the coronary artery (20, 50, and 100 μg in the left coronary artery, 20 and 50 μg in the right coronary artery). Thereafter, coronary angiography was repeated and an intracoronary injection of nitroglycerin was performed. Coronary spasm was defined as a transient total or subtotal obstruction with electrocardiographic changes and/or chest pain. After completion of diagnostic coronary angiography, optical coherence tomographic evaluation was performed in the culprit coronary artery before percutaneous coronary intervention. A 0.016-inch optical coherence tomographic imaging catheter (ImageWire, LightLab Imaging, Westford, Massachusetts) was advanced to the distal end of the culprit lesion through a 3-F occlusion balloon catheter (Helios, LightLab Imaging). To remove blood cells from the field of view during pullback image acquisition, the occlusion balloon was inflated to 0.5 atm proximal to the culprit lesion, and lactated Ringer solution was infused into the coronary artery from the distal tip of the occlusion balloon catheter at a rate of 0.5 ml/s, as described previously. For proximal lesions, a continuous-flushing (nonocclusive) technique was performed instead of the balloon-occlusion technique, as previously reported. In this continuous-flushing technique, a mixture of commercially available dextran 40 and lactated Ringer solution (low-molecular-weight Dextran L Injection, Otsuka Pharmaceutical Factory, Tokushima, Japan) was infused from the guiding catheter at 2.5 to 4.5 ml/s with an injector pump (Mark V, Medrad, Inc., Warrendale, Pennsylvania) to remove the blood during image acquisition. The entire length of the culprit coronary artery was imaged with an automatic pullback device moving at 1 mm/s.
All optical coherence tomograms were recorded digitally and analyzed by 2 independent investigators (MM and TA) who were blinded to clinical presentations. When there was discordance between observers, a consensus reading was obtained. Presence of a plaque rupture, an ulcer in a fibrous cap, intracoronary thrombus, or thin cap fibroatheroma was recorded and the minimum lumen area at the culprit site was measured. A plaque rupture was identified by the presence of fibrous cap discontinuity and cavity formation in the plaque. An ulcer in a fibrous cap was defined by loss of luminal integrity without fibrous cap disruption. An intracoronary thrombus was defined by the presence of an intraluminal mass protruding from the surface of the vessel wall. Optical coherence tomograms were analyzed with previously validated criteria for plaque characterization, and fibrous cap thickness was determined as described previously. Lipid plaque was semiquantified according to the number of involved quadrants on the cross-sectional image. When lipid was present in ≥2 quadrants in any of the images within a plaque, the plaque was considered lipid rich. A thin cap fibroatheroma was defined as a plaque with lipid content in ≥2 quadrants and the thinnest part of the fibrous cap measuring <70 μm. Spotty calcification was identified as a calcified plaque within an arc of <90° in >1 cross-sectional image of the culprit lesion. The 30-mm–long culprit lesion segment (15 mm proximal and 15 mm distal to the culprit lesion site) was used for assessment of frequency of thin cap fibroatheroma and spotty calcification. In patients with coronary spasm, optical coherence tomograms were analyzed during and after relief of the spasm.
PASW Statistics 17.0 (SPSS, Inc., Chicago, Illinois) software was used for statistical analysis. Continuous variables are expressed as median (quartiles 1 to 3) and were compared using Kruskal-Wallis test. If significant, pairwise comparisons using Bonferroni test were performed for multiple analyses. Categorical data are summarized as frequencies and percentages. Categorical variables were compared using Fisher’s exact test. A p value <0.05 was considered statistically significant.
Results
Of the enrolled 118 patients with primary UAP, 2 with congestive heart failure and 1 with cardiogenic shock were excluded from optical coherence tomographic examination. Thus, 115 patients with primary UAP constituted the final study population (Braunwald clinical classification: class I, n = 47; class II, n = 30; and class III, n = 38). Clinical characteristics of all 115 patients are presented in Table 1 . Patients in different groups showed no significant differences in age, gender, classic coronary risk factors, or culprit vessels.
| Variable | Class I | Class II | Class III | p Vaue |
|---|---|---|---|---|
| (n = 47) | (n = 30) | (n = 38) | ||
| Age (years) | 62 (56–71) | 63 (58–72) | 66 (58–73) | 0.71 |
| Men | 37 (79%) | 20 (67%) | 27 (71%) | 0.48 |
| Systemic hypertension | 32 (68%) | 21 (70%) | 26 (68%) | 0.98 |
| Diabetes mellitus | 19 (40%) | 11 (37%) | 21 (55%) | 0.24 |
| Dyslipidemia ⁎ | 26 (55%) | 20 (66%) | 24 (63%) | 0.57 |
| Smoking | 10 (21%) | 9 (30%) | 14 (37%) | 0.28 |
| Obesity † | 25 (53%) | 16 (53%) | 19 (50%) | 0.95 |
| Culprit coronary artery | 0.53 | |||
| Left anterior descending | 19 (40%) | 18 (60%) | 20 (53%) | |
| Left circumflex | 10 (23%) | 5 (17%) | 7 (18%) | |
| Right | 18 (38%) | 7 (23%) | 11 (30%) |
⁎ Total cholesterol level >220 mg/dl, low-density lipoprotein level >140 mg/dl, or triglycerides >150 mg/dl.
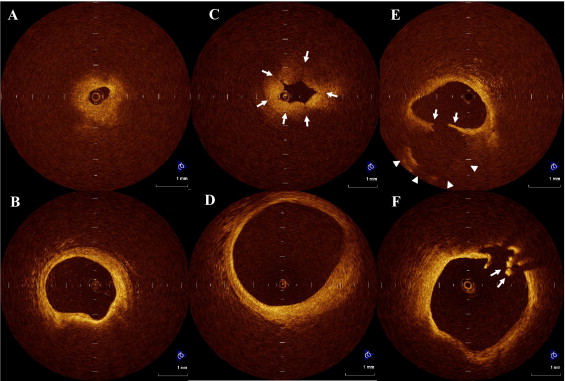
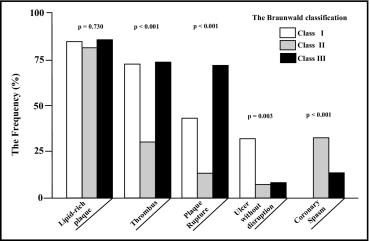
Culprit arteries were successfully observed in all patients using OCT without any serious procedural complications. Optical coherence tomographic findings for plaque disruption are presented in Table 2 . Representative cases in each class of the Braunwald classification are shown in Figure 1 . Incidence of plaque rupture was significantly different in culprit lesions of patients with Braunwald class I, II, and III UAP (p <0.001). Incidence of plaque rupture in class III was the highest in the 3 classes. In addition, plaque rupture was significantly more common in class I than in class II (p = 0.007). A significant difference in the incidence of ulcers without fibrous cap disruption was found among the 3 classes of Braunwald classification (p = 0.003), and those were detected most frequently in class I. Incidence of a culprit lesion without any disruptions including plaque rupture and ulceration was significantly higher in class II than in class I or III (p <0.001). Plaque characteristics are presented in Figure 2 and Table 3 . Number of quadrants involved by lipid did not significantly differ among the 3 classes (p = 0.187). Lipid-rich plaques were frequently detected in culprit lesions in all 3 classes, and their incidences did not differ significantly among classes (p = 0.730). Fibrous cap thickness in class III was the thinnest among the 3 classes (p <0.001; Figure 3 ).
| Variable | Class I | Class II | Class III | p Value |
|---|---|---|---|---|
| (n = 47) | (n = 30) | (n = 38) | ||
| Plaque rupture | 20 (43%) ⁎ | 4 (13%) | 27 (71%) ‡ | <0.001 |
| Ulcer | 15 (32%) ⁎ † | 2 (7%) | 3 (8%) | 0.003 |
| Neither | 12 (25%) | 24 (80%) ⁎ ‡ | 8 (21%) | <0.001 |
⁎ p <0.01, class I versus class II.
† p <0.01, class I versus class III.


| Variable | Class I | Class II | Class III | p Value |
|---|---|---|---|---|
| (n = 47) | (n = 30) | (n = 38) | ||
| Lipid plaque in quadrants 1/2/3/4 | 7/10/25/5 | 6/8/7/9 | 5/10/17/6 | 0.187 |
| Lipid-rich plaque (≥2 quadrants) | 40 (85%) | 24 (80%) | 33 (87%) | 0.730 |
| Fibrous cap thickness, μm | 140 (90–160) | 150 (120–160) | 60 (40–105) † ‡ | <0.001 |
| Thin cap fibroatheroma | 1 (0–1) | 0 (0–1) | 1.5 (1–2) † ‡ | <0.001 |
| Spotty calcification | 1 (0–2) ⁎ | 0 (0–0) | 1 (1–2) ‡ | <0.001 |
| Minimum lumen area (mm 2 ) | 0.70 (0.42–1.0) ⁎ † | 1.80 (1.50–2.50) | 2.31 (1.21–3.00) | <0.001 |
| Coronary spasm | 0 | 10 (33%) ⁎ | 5 (13%) | <0.001 |
| Thrombus | 34 (72%) | 9 (30%) ⁎ ‡ | 28 (73%) | <0.001 |
Stay updated, free articles. Join our Telegram channel

Full access? Get Clinical Tree


