Clinical Approach to Cardiovascular Magnetic Resonance Techniques
Hildo J. Lamb
Sebastian Kozerke Joost Doornbos Albert de Roos
INTRODUCTION
Cardiovascular MR (CVMR) techniques are still changing rapidly and CVMR is currently in an exciting and crucial phase for its final clinical acceptance. The main technical limitations are now overcome by development of improved scanner hardware, software, and image processing tools. In the present chapter, basic and advanced CVMR techniques will be discussed in the context of clinical application. Based on a virtual patient examination, relevant techniques will be discussed. The focus will be on techniques for functional evaluation of heart disease. Special attention is given to reduced data acquisition methods, since these techniques are causing a revolution within the field of CVMR. Magnetic resonance (MR) techniques for perfusion imaging, visualization of delayed enhancement, coronary artery MR angiography, and vessel wall imaging will be discussed in more detail in other chapters, and will be only briefly touched here.
COILS
Clinical cardiac exams can be performed using the standard body coil, although image quality is suboptimal. The main problem is the limited in-plane spatial resolution of around 3 mm2. High spatial resolution is especially important for accurate assessment of wall motion abnormalities due to, for example, myocardial infarction. In the past, reliable images were obtained using the body coil for assessment of global and regional myocardial wall motion (Fig. 1.1). When an imaging center is particularly interested in CVMR, it is worth using a standard surface coil, such as a single circular coil with a diameter of approximately 14 cm, which improves image quality and spatial resolution substantially. The best alternative is a dedicated cardiac phased array coil constructed of multiple elements. This type of coil is now commercially available from most scanner manufacturers (Fig. 1.1). The main advantage is the further improved image quality, spatial resolution, and the larger field of view. An additional advantage is that phased array coils allow application of the SENSE technique (1). SENSE represents a revolutionizing technology in CVMR. Its principle is based on parallel imaging with use of all coil elements. Each coil has a different sensitivity profile, which can be exploited to unfold undersampled acquisitions, and to reduce the density of the acquired k-space data, thus speeding up scan time (see below for details). Using SENSE, currently a twofold increase in imaging speed can be obtained standard, in an experimental setting higher factors were reached. In general, SENSE is believed to contribute significantly to the clinical acceptance of CVMR, because it reduces MR scan time, making it comparable to ultrasound or CT examinations.
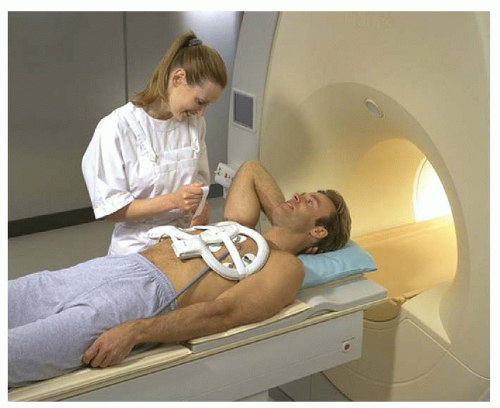 Figure 1.1. Practical setup of a dedicated cardiac phased array coil and vector ECG. The standard body coil is integrated with the magnet bore. Courtesy of Philips Medical Systems, Best, The Netherlands. |
CARDIAC MOTION COMPENSATION
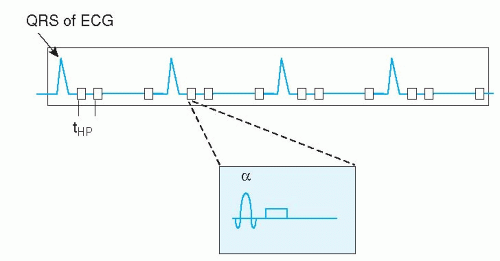 Figure 1.2. Schematic diagram of the basic principle of a gradient echo MR sequence (GRE, or fast field echo (FFE)) in relation to the timing within the cardiac cycle. After each radio frequency (rf) excitation pulse (α, one line in k-space is acquired (gray area). In total, four heart beats are shown, resulting in an image of four k-lines. Suppose an image of 120 k-lines is required, the procedure needs to be repeated 30 times, leading to a total of heart beats of 120. With a heart rate of 60 beats per minute, the acquisition can be completed during continuous breathing within 2 minutes. White squares indicate heart phase image segments, tHP = time between each heart phase (temporal resolution). |
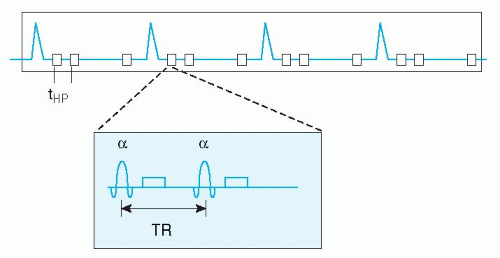 Figure 1.3. Schematic diagram of the basic principle of a turbo field echo MR sequence (TFE) in relation to the timing within the cardiac cycle. After each rf excitation pulse (α, one line in k-space is acquired, which is repeated two times in this case (turbo factor 2), leading to a total of two acquired k-lines per heart phase image segment per cardiac cycle (gray area). In total, four heart beats are shown, resulting in an image of eight k-lines. Suppose an image of 120 k-lines is required, the procedure needs to be repeated 15 times, leading to a total of heart beats of 60. With a heart rate of 60 beats per minute, the acquisition can be completed during continuous breathing within 60 seconds. White squares indicate heart phase image segments, tHP = time between each heart phase (temporal resolution). TR = repetition time between rf excitations. |
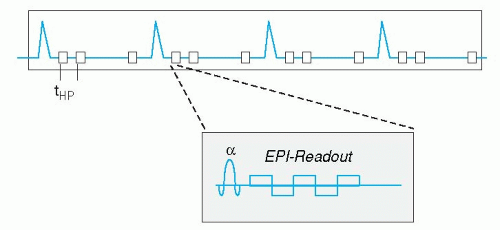 Figure 1.4. Schematic diagram of the basic principle of an echo-planar MR sequence (EPI) in relation to the timing within the cardiac cycle. After each rf excitation pulse (α), in this example five lines in k-space are acquired (EPI factor 5), leading to a total of five acquired k-lines per heart phase image segment per cardiac cycle (gray area). In total, four heart beats are shown, resulting in an image of 20 k-lines. Suppose an image of 120 k-lines is required, the procedure needs to be repeated six times, leading to a total of heart beats of 24. With a heart rate of 60 beats per minute, this can be performed during a breath-hold of 24 seconds. White squares indicate heart phase image segments, tHP = time between each heart phase (temporal resolution). |
Cardiac motion compensation is performed by synchronizing the image acquisition to the electrocardiogram (ECG) signal. Image formation in MR is based on filling “k-space” during data acquisition (see Appendix), this concept will not be explained further in this context, since many thorough and comprehensive publications are available on this topic (2,3,4,5 and 6). ECG-triggering is aimed at filling k-space in multiple steps, based on the timing within the cardiac cycle (Figs. 1.2,1.3,1.4,1.5 and 1.6). For example, to construct a movie of a cardiac slice, approximately 20 cardiac phases (time frames) are needed to obtain a sufficiently high temporal resolution. In general, a time resolution of <40 milliseconds per cardiac phase image is needed to enable selection of the end-systolic time frame, for calculation of, for example, the end-systolic volume and ejection fraction. For high-resolution clinical imaging, these 20 cardiac images per slice cannot be obtained at once. Therefore, ECG triggering was developed, to synchronize the partial k-space filling to the cardiac cycle. Suppose we need 128 k-lines for the first cardiac phase image, but we can only acquire 12 k-lines for that image per heart beat, then 11 heart beats are needed to complete k-space filling for that image. This would take a breath-hold of approximately 11 seconds at a heart rate of 60 beats per minute. Of course all 20 cardiac
phases are acquired at once, so within 11 seconds a full movie of a cardiac slice can be obtained.
phases are acquired at once, so within 11 seconds a full movie of a cardiac slice can be obtained.
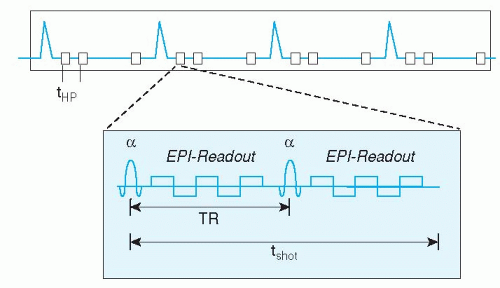 Figure 1.5. Schematic diagram of the basic principle of a turbo field echo-planar MR sequence (TFEPI) in relation to the timing within the cardiac cycle. After each rf excitation pulse (α, in this case five lines in k-space are acquired (EPI factor 5), which is repeated two times per shot (turbo factor 2), leading to a total of ten acquired k-lines per heart phase image segment per cardiac cycle (gray area). In total, four heart beats are shown, resulting in an image of 40 k-lines. Suppose an image of 120 k-lines is required, the procedure needs to be repeated three times, leading to a total of heart beats of 12. With a heart rate of 60 beats per minute, this can be performed during a breath-hold of 12 seconds. White squares indicate heart phase image segments, tHP = time between each heart phase (temporal resolution), TR = repetition time, tshot = shot duration. |
Currently two types of ECG triggering methods are available. The first is prospective triggering, meaning that image acquisition starts at a fixed delay after the QRS-complex of the ECG, and stops around 80% of the cardiac cycle. Consequently, the 20 cardiac phases are distributed over this 80% of time. In this way, the last 20% of the cardiac cycle is not imaged. This technique is suitable to image systolic heart function. When one is interested in the last part of the cardiac cycle to evaluate diastolic heart function, a different method can be applied. Retrospective ECG gating acquires image data irrespective of the ECG, while the ECG is recorded in parallel. Once the MR acquisition is finished, the computer calculates afterwards (retrospectively) the appropriate cardiac phases, based on the stored ECG and k-space data. In this way, the last part of the cardiac cycle can be imaged also. This technique has been applied clinically mostly in conjunction with MR flow mapping (see below), since it allows estimation of, for example, diastolic filling pattern or regurgitation volume in patients with mitral valve insufficiency. Recently, retrospective gating became available in combination with faster scan techniques, such as echo-planar imaging and balanced gradient echo acquisitions (see below), so the standard nowadays is retrospective ECG triggering for most CVMR imaging purposes.
A major problem for clinical application of cardiac CVMR is the practical worry of obtaining a reliable ECG signal from a patient inside the MR scanner. In about 2% to 5% of clinical cases, no reliable ECG signal may be obtained. The electrical ECG signal is distorted by the interaction of the magnetic field and the pulsating blood flow through the aortic arch (magnetohemodynamic effect). Recently, a new approach was launched to correct for this problem. The vector ECG (VCG) is based on the 3-dimensional orientation of the QRS-complex and T-wave of the ECG and the distorting component (7). In this way, the MR acquisition can be triggered by the QRS-complex only and neither by mistake by the T-wave or ECG distortions nor by signal induced by gradient switching. The VCG, in conjunction with the dedicated cardiac synergy surface coil and SENSE, has revolutionized clinical application of CVMR (Fig. 1.1). Today, there is no practical limitation for CVMR, except for the conventional MR exclusion criteria, such as unstable or sensitive implanted metal objects or pregnancy.
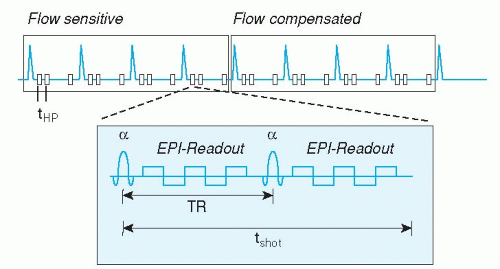 Figure 1.6. Schematic diagram of the basic principle of a turbo field echo-planar MR flow sequence (TFEPI flow) in relation to the timing within the cardiac cycle. After each rf excitation pulse (α, in this case five lines in k-space are acquired (EPI factor 5), which is repeated two times (turbo factor 2), leading to a total of ten acquired k-lines per heart phase image segment per cardiac cycle (gray area). In total, four heart beats are shown for the flow sensitive image, as well as four heart beats for the flow compensated image, resulting in images of 40 k-lines for each image type. Suppose the images require 120 k-lines for a sufficiently high spatial resolution, the procedure needs to be repeated three times, leading to a total of heart beats of 24. With a heart rate of 60 beats per minute, this can be performed during a breath-hold of 24 seconds. White squares indicate heart phase image segments, tHP = time between each heart phase (temporal resolution), TR = repetition time, tshot = shot duration. |
RESPIRATORY MOTION COMPENSATION
A second source of image distortion is respiratory motion. A decade ago, MR acquisitions were so time consuming that it was impossible to perform breath-hold imaging. At that time, an inventive technique was introduced called respiratory ordered phase encoding (ROPE) (8) or phase encoding artifact reduction (PEAR), which was based on a special k-line reordering technique, combined with a respiratory tracking device around the abdomen. By positioning acquired k-lines during breathing in the periphery of k-space (this is the part of k-space less sensitive to motion), breathing artifacts were decreased. This type of artifact reduction improved image quality, but was not optimal yet, because the indirect relation between abdominal movement and the actual heart motion.
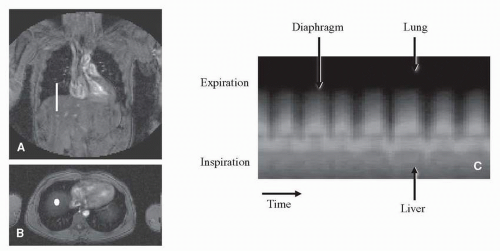 Figure 1.7. The respiratory navigator pencil beam (A, white line, B white dot) is positioned on the right hemi-diaphragm at the interface between lung and liver, based on a survey image in the coronal (A) and sagittal (B) plane. The one-dimensional navigator image is acquired repeatedly over time, thereby constructing an image of diaphragmatic motion (C). The edge between lung and liver is traced automatically, yielding a breathing curve similar to that represented in the diagram of Figure 8. |
Due to the development of faster MR imaging techniques, such as echo-planar imaging and turbo-field echo imaging, it became possible to acquire image data during a short breath-hold of around 15 seconds. The general disadvantage of breath-hold acquisitions is that the reproduc-ibility of the breath-hold level is not optimal. In a multi-slice multiple breath-hold acquisition, this may introduce errors in, for example, the summed end-diastolic volume of different slices which were acquired during different breath-holds. Without proper patient instruction, this can lead to high variability in the measurements, or even worse, to inaccurate clinical data. So when using breath-hold acquisitions, it is necessary to instruct the patient carefully to hold his breath in expiration, which minimizes the above-mentioned problem of breath-hold level reproducibility.
Some high-resolution MR acquisitions require longer acquisition times than possible during a breath-hold. For example, coronary artery MR angiography can be performed during a short breath-hold, but the optimal quality can only be obtained by using the respiratory navigator technique (9,10). Respiratory navigation is based on a 1-dimensional image positioned at the interface between lung and liver. In this way the motion of the diaphragm can be tracked. Usually, the navigator beam is positioned on the right hemi-diaphragm (Fig. 1.7) and is acquired before and after every MR data acquisition block (Fig. 1.8), with an acquisition duration of only 30 milliseconds. The acquisition is then gated to the automatically traced breathing signal derived from the respiratory navigator. A window around the end-expiration position of the diaphragm is defined, determining the positions in which MR data is accepted. For example, a 3 mm acceptance window means that in end-expiration, still 3 mm motion is accepted to occur. Respiratory navigators can also be used for slice tracking; this means that the slice position is adjusted respective to the breathing changes as detected by the navigator. In this way, the acquisition is not gated to a certain predefined acceptance window, but acquires all scanned data. The combination of these two techniques seems currently the best solution. Within the acceptance window, of say 3 mm, the remaining respiratory motion is compensated by using the tracking technique. This technique showed good results for coronary magnetic resonance angiography (MRA) (11).
Recent technical advances have made it possible to acquire a stack of 12 slices, with around 25 cardiac phases each, in a single breath-hold of up to 20 seconds. These ultra-fast techniques are combinations of turbo-field echo, echo-planar, or spiral k-space acquisition. The first application is the assessment of cardiac function, because the single breath-hold eliminates the previously mentioned problem of slice level reproducibility in multiple breath-hold approaches. However, the image spatial resolution of this technique is still quite low, allowing only evaluation of ventricular volume changes and some rough estimation of wall motion abnormalities. In the future, combination of the ultra-fast acquisition schemes with SENSE may allow higher resolution imaging. A promising technique for ultra-fast whole heart functional imaging in a single breath-hold is the so called k-t BLAST technique (see below).
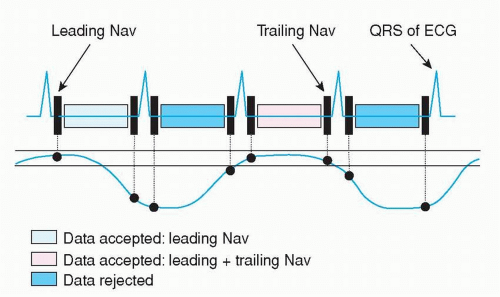 Figure 1.8. The MR acquisition is gated to a predefined acceptance window (two solid horizontal lines) based on the traced respiratory signal (curved solid line) around end-expiration. K-space data is acquired continuously, but only data are stored that fulfill the requirement that (1) before data acquisition the navigator was within the acceptance window (leading navigator); or that (2) before and after data acquisition the navigator was within the acceptance window (leading and trailing navigator). Other acquired image data is deleted. This is the principle of a real-time prospective respiratory navigator. |
Another promising development is real-time imaging of the heart. Real-time cardiac imaging was introduced already in the early days of MR (12). Recently data has been
presented showing full ventricular coverage in real time without the need for ECG-triggering or breath-holding (13,14). In these preliminary studies, accurate quantification was shown for ventricular function. In combination with future real-time image analysis, this may revolutionize the way we look at CVMR.
presented showing full ventricular coverage in real time without the need for ECG-triggering or breath-holding (13,14). In these preliminary studies, accurate quantification was shown for ventricular function. In combination with future real-time image analysis, this may revolutionize the way we look at CVMR.
SURVEY
The first step for the CVMR examination is the acquisition of a localizer to determine general anatomy, which forms the basis for further acquisitions. The purpose of this first scan is to image the cardiac region in three basic orientations: coronal, transverse, and sagittal planes, using 15 slices of 10 mm each for every orientation. A decade ago, these “scout” images were obtained by using a multi-slice spinecho technique, sometimes in combination with turbo spin-echo. This technique can still be used if your local MR scanner does not support faster imaging techniques. A faster technique for acquiring survey images is, for example, a turbo-field-echo or turbo-field-echo-planar MR sequence.
Recently, balanced gradient echo (bFFE, bTFE, true-FISP) techniques became available, yielding images with high contrast between blood and myocardium (Figs. 1.9 and 1.10). Survey images can be acquired during continuous breathing, using the respiratory navigator, or during a breath-hold. Currently, excellent images can be obtained using balanced-FFE without respiratory motion compensation, with an acquisition time of only 15 seconds.
PLAN SCAN
Based on survey images, further MR scans can be planned. This can be performed by hand, using the planning tools available in the standard scanner software. Since the beginning of the new millennium, planning can be performed in real time, even in combination with balanced-TFE. With a real-time planning tool, manual changes in imaging plane are immediately executed by the free-running MR acquisition. In this way, the optimal imaging plane can be found within seconds. Once the desired imaging plane is reached, the geometry settings can be stored for later use during the CVMR exam. The time efficiency increases substantially by using this real-time planning tool, allowing routine application of CVMR.
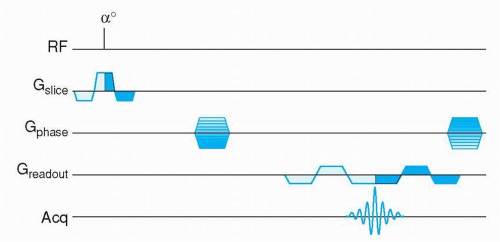 Figure 1.9. Balanced FFE pulse sequences belong to the group of “Steady State Free Precession” techniques. Time-balanced gradients are applied for all gradient directions: slice selection, phase encoding, and frequency readout. In combination with the alternating phase of the excitation pulse this enables acquisition of both FID and Echo signal. The sequence produces a high image intensity for tissues with a high T2/T1 ratio, independent of the repetition time TR. Balanced FFE images are obtained after field shimming, since field homogeneity is very important. |
Another approach is to use the survey images as input for an algorithm, which plans the desired imaging planes automatically (15). Its principle is that the software package finds the position of heart in the survey images automatically, and uses this information for the planning of the other acquisitions. This operator-independent automatic plan scan method yields reliable quantification of, for example, end-diastolic volume and ejection fraction, and reduces inter-examination variability substantially. Therefore, this method is ultimately suitable for patient follow-up to evaluate therapy effects of, for example, antihypertensive or lipid-lowering drugs. However, the automatic plan scan procedure is currently only available offline as a research tool, and the time-efficiency of the real-time planning alternative seems to be higher.
ANATOMY
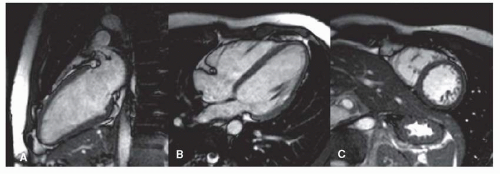 Figure 1.10. Example of balanced FFE images acquired in the two-chamber view (A), four-chamber view (B), and short-axis view (C). Each image consists of 25 cardiac time frames, which were acquired during a breath-hold of 12 seconds for each view separately. Images are shown in the end-diastolic time frame. Note the excellent contrast between blood and myocardium, as compared to the echo-planar images in the other figures of this chapter. |
Today, the main patient category with a clinical referral for CVMR is congenital heart disease. The primary interest of the referring physician is usually evaluation of global cardiovascular anatomy. The purpose of these MR scans is to image the heart in three dimensions. In this way, complex congenital cardiac deformations can be diagnosed and followed over time to evaluate surgical correction of the
anomalies. In the past, the time consuming (turbo) spin-echo was the technique of choice. The major disadvantage of this technique was the presence of major breathing artifacts, hampering routine evaluation of cardiac anatomy.
anomalies. In the past, the time consuming (turbo) spin-echo was the technique of choice. The major disadvantage of this technique was the presence of major breathing artifacts, hampering routine evaluation of cardiac anatomy.
Nowadays, several alternatives are available. The latest technique is a multiple breath-hold dual inversion black blood turbo spin-echo technique (Figs. 1.11 and 1.12), which yields excellent image quality (16). Disadvantage of this approach is that each slice has to be imaged during a separate breath-hold, with again the problem of breath-hold level reproducibility. The expectation is that in the future this technique will be further optimized, for example, by combining it with SENSE, allowing single breath-hold or respiratory navigator gated acquisitions.
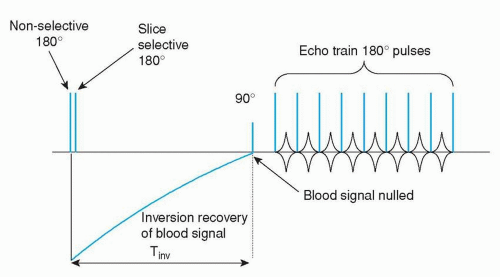 Figure 1.11. Schematic diagram of a black blood pulse sequence. A nonselective 180° pulse inverts all signals. Subsequently a slice-selective 180° pulse resets signal of the studied slice. Blood with inverted signal flows into the slice plane. After a delay (Tinv = inversion time) the blood signal is nulled and data acquisition is performed with a fast spin echo pulse train. The image is obtained in a breath-hold. Note that Tinv is dependent on the heart rate. |
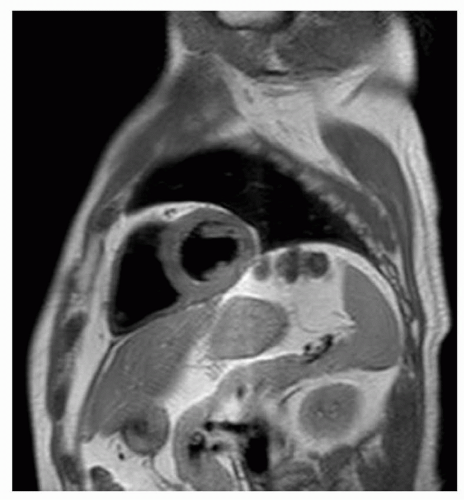 Figure 1.12. The “black blood” image was obtained using a dual inversion fast spin echo technique, in combination with SENSE (factor 2). Echo spacing 4.3 milliseconds, FOV 350 × 350 mm, matrix 192 × 146, slice thickness 8 mm. Scan time was 6 seconds. Courtesy of Philips Medical Systems, Best, The Netherlands. |


