Circumferential Atrial Ablation
Carlo Pappone
Vincenzo Santinelli
At present, there is a great enthusiasm for the possible use of radiofrequency catheter ablation techniques to “cure” atrial fibrillation (AF). According to the new guidelines for AF treatment, radiofrequency catheter ablation has evolved rapidly becoming an established treatment strategy for AF. There are many ablation strategies that have been demonstrated to be effective in eliminating AF in patients with or without associated diseases. Triggers originating from the pulmonary veins (PVs) and other thoracic veins are the primary mechanisms in paroxysmal AF. Ablation strategies such as PV isolation that only target triggers are insufficient to cure permanent AF that presents at the end stage of the disease and is the most challenging clinical form.
The circumferential atrial ablation or CPVA consists of large circumferential lesion lines to perform a point-by-point tailored proximal disconnection of all PVs and additional lesion lines that further reduce the anatomic, electrophysiologic, and autonomic substrates (1, 2, 3, 4, 5, 6, 7, 8, 9, 10, 11, 12, 13, 14, 15, 16, 17, 18, 19, 20, 21). The procedure can be performed either by manually deflectable catheters (standard CPVA) or remotely (remote CPVA) by a soft magnetic catheter, and has been demonstrated to be effective in curing patients with AF (1, 2, 3, 4, 5, 6, 7, 8, 9, 10, 11, 12, 13, 14, 15, 16, 17, 18, 19, 20, 21). In patients with permanent AF, further lesions are performed to achieve sinus rhythm (SR) and noninducibility of both AF and atrial tachycardia (AT) at the end of the procedure. The ablation lines are guided by 3-D electroanatomic mapping systems (CARTO or NavX).
Prior to ablation, patients have transesophageal echocardiography to exclude a left atrial thrombus. Before transseptal puncture, a catheter is placed inside the coronary sinus to map for left atrial activity, and a multipolar catheter is placed inside the right atrium to map for right atrial activity. The procedure requires a single transseptal puncture for the mapping/ablation catheter. Following transseptal access a single bolus of heparin is administered and two blood samples are taken every 15 minutes in order to monitor the activated clotting time, which needs to be ≥250 seconds.
Approximately 10 years ago, the use of 3-D nonfluoroscopic technology was one of the initial developments that permitted advances in cardiac mapping. CARTO (Biosense-Webster, Diamond Bar, CA), EnSite-NavX (St. Jude Medical, St. Paul, MN), LocaLisa (Medtronic, Minneapolis, MN), and RPM (Boston Scientific, Natick, MA), have all been used for positioning of catheters in virtual 3-D space in a real-time fashion with reduced use of fluoroscopy and with enhanced safety. The 3-D nonfluoroscopic technology has advantages and disadvantages.
All of these navigation systems primarily require catheter movement to create a virtual geometry, which is mostly operator dependent and cannot predict anatomy on its own. The 3-D maps are formed by the maximum excursion of the mapping catheter within the chamber of interest. If an inadequate number of points are used to construct a map, the map will not be accurate and may underestimate the true anatomy size, rendering it useless. If a greater number of points are utilized, then the result may be a deformed virtual chamber, with both the surface and volume overestimated.
Over the years, we have adapted to the use of 2-D fluoroscopic images in combination with electrogram signals to know the position of the navigating catheter in the heart. For AF ablation, fluoroscopy alone does not show the complex anatomy of the LA and is unable to show whether lesions are contiguous, thus allowing to perform complete lines of block. Advanced technology offers the virtual 3-D view of the cardiac chamber of interest, as opposed to the real 2-D view provided by fluoroscopy. As a result of the enhanced spatial resolution that 3-D anatomic views provide, the ability to obtain highly detailed activation maps, and catheter navigation features render an accurate mapping and ablation at specific endocardial targets. The ability to tag points of interest enables the operator to return to ablation sites at any time during the procedure to make contiguous lesion lines. This facilitates precise left atrium (LA) ablation, entrainment mapping, identification of atrial scar, validation of conduction block with linear lesions, identification of sites of vagal stimulation, or impedance gradients.
Currently we use both CARTO and NavX technology for intracardiac geometry reconstruction, mapping, and ablation of patients undergoing CPVA. Because these two electroanatomic systems are different as they utilize different sources and algorithms, for clarity we will describe mapping and ablation with CARTO and NavX separately.
The first to be used was the CARTO system for both mapping and ablation of AF. This 3-D system accurately determines the location and orientation of the mapping/ablation catheter using three ultra-low magnetic fields, which are generated by coils within a locator beneath the operating table and simultaneously records the local electrogram from its tip. While reconstructing the virtual 3-D geometry by adequately sampling density, color-coded electrophysiologic data can be superimposed on the anatomy with a complete representation of endocardial voltage distribution. Accurate acquisition of points requires an adequate wall contact of the catheter tip and continuous catheter stability, both of which are operator dependent. In experienced hands, an adequate LA geometry for an optimal ablation can be reconstructed in less than 10 minutes.
At present open irrigated-tip catheters are used with an irrigation rate of 2 to 50 mL/min to maintain the desired power (50W). The irrigation allows one to perform
deeper lesions at constantly lower power settings, compared with nonirrigated 4- to 8-mm catheters used in the past, without the risk of carbonization of the tip, which could lead to left atrial thrombus formation. Throughout the whole mapping procedure the tip is irrigated at a rate of 2 mL/min. An example of step-by-step reconstruction of LA electroanatomic map by CARTO is shown in Figure 10.1.
deeper lesions at constantly lower power settings, compared with nonirrigated 4- to 8-mm catheters used in the past, without the risk of carbonization of the tip, which could lead to left atrial thrombus formation. Throughout the whole mapping procedure the tip is irrigated at a rate of 2 mL/min. An example of step-by-step reconstruction of LA electroanatomic map by CARTO is shown in Figure 10.1.
 Figure 10.1. Final detailed virtual map of the left atrium with CARTO shown in different anatomic views (A-F). See color insert 2. |
The first step is to reconstruct all PVs. To better define the PV ostia, it is necessary to acquire more than one point inside each PV. In order to be certain that the mapping catheter is inside the PV, simultaneous confirmation by fluoroscopy, impedance gradients, and electrograms is necessary. When using fluoroscopy, once the catheter enters the PV, the tip is characteristically seen outside the cardiac shadow. Second, the operator checks for impedance values, which significantly rise when each PV is entered while atrial electrograms simultaneously disappear. Impedance mapping (impedance rise ≥4 Ohms relative to the LA indicates PV ostium) in conjunction with 3-D mapping reliably identifies the LA-PV transitional zone, allowing safe ablation within the LA, and its use is associated with a low incidence of PV stenosis (20).
After PVs are acquired we perform a point-by-point reconstruction of the posterior and anterior walls, left atrial appendage (LAA), roof, mitral annulus with its isthmus, ridge between the LAA and LSPV, and septal region (Fig. 10.1). As shown, acquisition of many more points is required to better delineate challenging areas for ablation such as the septum and the ridge between the LAA and the LSPV (Fig. 10.1, Panel C). When mapping the right inferior or superior PVs, far-field electrical activity may be recorded from the proximal electrodes. So when validating this region it is important to push the catheter deeper in order to reduce this influence.
The LAA is one of the latest areas to be mapped (Fig. 10.1, Panel C). It is an easy region to identify because its potentials are characteristically not fractionated and of high amplitude. When mapping the LAA every effort should be made to accurately define the ridge, which characteristically shows potentials that are higher and more fractionated than in the rest of the atrium, but smaller than those of the LAA. If the ridge is not accurately reconstructed, the left-sided circumferential lesion line may be deployed too close to the LAA or within the PV ostium, which may result in poor efficacy and major complications.
The septal area, which is close to the inferior portion of the right inferior PV, also represents a challenging region for both mapping and ablation and it should be accurately reconstructed by acquiring many points, requiring a stable catheter-wall contact (Fig. 10.1, Panel E). When reconstructing the roof we acquire sufficient points to avoid an inadequate interpolation by the CARTO system (Fig. 10.1, Panels A, B, and E).
After reconstruction of the LA shell with CARTO, ablation is started to encircle the left- and right-sided PVs, 1 to 2 cm from their ostia, with additional linear lesions in the posterior wall between the superior and inferior PVs and mitral isthmus (Fig. 10.2). When ablation starts, the irrigation rate of the catheter tip is raised from 2 to 17 mL/min. Impedance, ablation time, and tip temperature values are constantly monitored. RF energy is immediately discontinued if an increase ≥10 Ohms in impedance occurs. Irrigation rate is titrated to achieve the desired power. Energy output is limited to
50W and 48°C throughout the entire ablation procedure. RF energy is delivered to the entire circumference around all PVs by the creation of circular lesions outside each PV ostium or by the creation of two larger circumferential lesions around the right and left PV ostia.
50W and 48°C throughout the entire ablation procedure. RF energy is delivered to the entire circumference around all PVs by the creation of circular lesions outside each PV ostium or by the creation of two larger circumferential lesions around the right and left PV ostia.
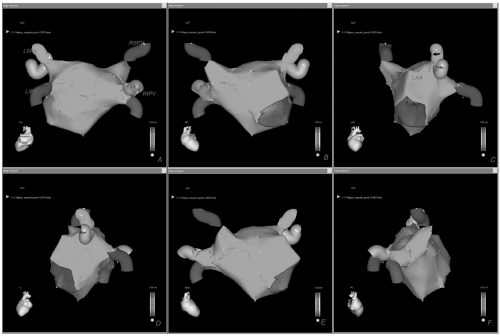 Figure 10.2. Using a cooled-tip catheter with a dragging technique, a point-by-point continuous ablation line (red dots) begins from the mitral annulus toward the left-sided PVs (isthmus line) (A, B). Further sequential RF applications on the ridge between the LAA and the left superior PVs complete the circular line that encircles the left PVs (C, D) and then, the right-sided PVs (E). The line between the right PVs is usually deployed at the end of the ablation procedure (F). G: An additional line connects the superior (roof line) and inferior PVs on the posterior wall. In this patient a linear lesion line on the septum starting from the anterior lower part of the right circumferential lesion up to the mitral valve has been deployed (H). See color insert 2. |
Visualization of ablation lines by 3-D mapping facilitates creation of a continuous line and helps to avoid repeated unnecessary energy delivery at sites that have already been targeted. Demonstration of electrical isolation by a circular mapping catheter is not required because we create a true proximal electrical disconnection by complete potential abatement not only on the lesion line but also within the encircled areas. For this purpose, careful attention should be given to catheter stability and attenuation of the local electrogram during each RF energy application or partially ablated signals before moving on the next ablation site.
Stay updated, free articles. Join our Telegram channel

Full access? Get Clinical Tree


