There are limited data integrating findings on right-sided cardiac catheterization and cardiopulmonary exercise testing in ambulatory patients with heart failure. In this study, 187 outpatients with HF referred to the Duke Medical Center for consideration of advanced HF therapies were retrospectively evaluated. All patients had undergone right-sided cardiac catheterization and cardiopulmonary exercise testing; the median cardiac index (CI) was 2.0 L/min/m 2 (interquartile range 1.7 to 2.3), and the median peak oxygen consumption was 11.3 ml/kg/min (interquartile range 9.2 to 13.8). Despite aggressive medical therapy, medical management had failed in 97 patients (52%) at 18 months, defined as left ventricular assist device implantation, cardiac transplantation, or death. After multivariate adjustment, factors associated with failure of optimal medical management included percentage achieved of predicted peak oxygen consumption, low CI (i.e., <2 L/min/m 2 ), left ventricular size, and exercise time. Patients with discordant findings on right-sided cardiac catheterization and cardiopulmonary exercise testing were common, occurring in 88 patients (47%). The most common profile was preserved CI but reduced functional capacity, and these patients remained at high risk for requiring advanced therapies, whereas patients with reduced CIs but preserved exercise capacity were uncommon. In conclusion, low CI was independently associated with higher rates of death, transplantation, and left ventricular assist device implantation in this study. Also, patients with preserved CIs at rest but poor functional capacity, so-called cardiac insufficiency, were commonly encountered and had poor outcomes with medical management.
Highlights
- •
This study integrated invasive hemodynamics with CPX.
- •
Discordant findings with these 2 tests were seen in 47% of the cohort.
- •
Patients with “cardiac insufficiency” had preserved CIs but poor functional capacity.
- •
Low CI was independently associated with poor outcomes.
- •
Other factors associated with poor outcomes were %VO 2 , LV size, and exercise time.
Recommendations for the optimal timing of advanced heart failure therapies, including left ventricular assist device (LVAD) implantation and cardiac transplantation, depend on estimates of risk for developing end-organ dysfunction or death. Cardiopulmonary exercise testing (CPX) is well established to determine patients’ risk for death without transplantation, but invasive hemodynamic testing by right-sided cardiac catheterization (RHC) is also routinely performed at regular intervals for patients being considered for advanced heart failure therapies. The interaction between measures of exercise or functional capacity and invasive hemodynamics has not been well described, and there is a paucity of data to guide the appropriate integration of RHC measurements with other clinical information. We designed a retrospective study of ambulatory patients with heart failure to determine the relative impact of invasive hemodynamic data and functional capacity measured by CPX on clinical outcomes in a contemporary era. We also sought to understand the prevalence and outcomes of patients with discordant findings at the time of RHC and CPX.
Methods
We studied consecutive patients seen from 2005 to 2010 in the advanced heart failure clinic at Duke University Medical Center. All patients included in the analysis underwent RHC and CPX within a 3-month window, and the mean time between tests was 5 days. Patients treated with inotropic agents or vasopressors at the time of RHC were excluded. Other clinical data were evaluated by chart review by a single physician extractor. The Duke Institutional Review Board approved this study.
CPX was performed using either the Ekeland or Naughton protocol, and calculations for predicted peak oxygen consumption (VO 2 ) were made by using the Wasserman equation. Other information recorded included exercise time, respiratory exchange ratio, percentage achieved of predicted VO 2 (%VO 2 ), and minute ventilation/carbon dioxide production slope, which was calculated by using liner regression analysis of the entire data set from the exercise test, including the initiation and termination of testing. Invasive hemodynamic testing by RHC was performed in the cardiac catheterization laboratory. The Fick equation using assumed VO 2 was used to calculate cardiac output and subsequently the cardiac index (CI). Assumed VO 2 was calculated as VO 2 (ml/min) = 125 ml/min/m 2 × body surface area (m 2 ). Mixed venous oxygen saturation was measured from blood drawn from a branch pulmonary artery using standard catheterization laboratory procedures. Echocardiographic data were collected retrospectively from chart review. The left ventricular ejection fraction was estimated visually, and right ventricular dysfunction was graded by visual estimate as none, mild, moderate, or severe. Mitral and tricuspid regurgitation were also graded as none, mild, moderate, or severe.
Failure of optimal medical management, defined as death, cardiac transplantation, or LVAD placement, was the end point in this analysis. These end points were extracted from the medical record and the Social Security Death Index.
Continuous variables are summarized as medians and interquartile ranges (IQRs) and categorical variables as frequencies and percentages. Patients in whom optimal medical management failed were compared with those in whom it was successful using Cox regression models. After stratification into hemodynamic groups, patients were compared by using Wilcoxon’s tests or Fisher’s exact tests. Event rates were estimated by using the product limit estimator (Kaplan-Meier). Univariate and multivariate models (adjusting for potential confounders) were fitted using the Cox regression model. Candidate variables were selected for use in the multivariate model on the basis of clinical judgment. Results are presented as hazard ratios and 95% confidence intervals. The C index was used as a measure of the discriminatory ability of the model. A p value <0.05 was considered statistically significant.
Results
The study population included 187 patients. Table 1 lists the baseline characteristics of the study population. The median age of the cohort was 56 years (IQR 46 to 63), with 29% women, 36% African Americans, and 41% with ischemic cardiomyopathy. Overall, the population was well treated at baseline, with >80% receiving angiotensin-converting enzyme inhibitors or angiotensin receptor blockers and β blockers. The median CI was 2.0 L/min/m 2 (IQR 1.7 to 2.3), and the median peak VO 2 was 11.3 ml/kg/min (IQR 9.2 to 13.8).
| Variable | Overall (n = 187) Median (IQR) or N (%) | Failed Medical Management Death/Transplant/VAD (n = 97) Median (IQR) or N (%) | Event-free Survival Alive With no Event (n = 90) Median (IQR) or N (%) | p-Value |
|---|---|---|---|---|
| Age (years) | 56 (46–63) | 56 (47–63) | 56 (46–63) | NS |
| Female | 55 (29%) | 30 (31%) | 25 (28%) | NS |
| African-American | 67 (36%) | 40 (41%) | 27 (30%) | NS |
| Ischemic Cardiomyopathy | 77 (41%) | 39 (40%) | 38 (42%) | NS |
| Systolic BP (mm Hg) | 113 (102–128) | 108 (98–124) | 117 (107–130) | 0.002 |
| Diastolic BP (mm Hg) | 74 (66–84) | 71 (65–83) | 78 (69–85) | 0.007 |
| Heart Rate (beats per minute) | 75 (66–88) | 73 (66–86) | 78 (66–88) | NS |
| Medical Therapy | ||||
| ACE Inhibitors/ARBs | 158 (85%) | 79 (81%) | 79 (88%) | NS |
| Beta Blockers | 169 (90%) | 82 (91%) | 87 (90%) | NS |
| Aldosterone Antagonists | 117 (63%) | 63 (65%) | 54 (60%) | NS |
| Digoxin | 76 (41%) | 35 (39%) | 41 (42%) | 0.043 |
| Long-Acting Nitrate | 17 (9%) | 12 (13%) | 5 (5%) | NS |
| Hydralazine | 16 (9%) | 9 (10%) | 7 (7%) | NS |
| Loop Diuretics | 165 (88%) | 80 (89%) | 85 (88%) | NS |
| ICD | 147 (79%) | 77 (79%) | 70 (78%) | NS |
| CRT | 77 (41%) | 48 (50%) | 29 (32%) | 0.018 |
| Laboratory Values | ||||
| Sodium (mmol/L) | 138 (136–140) | 138 (136–140) | 138 (137–140) | NS |
| Blood Urea Nitrogen (mg/dl) | 21 (15–28) | 22 (16–30) | 19 (14–27) | NS |
| Creatinine (mg/dl) | 1.2 (1.0–1.6) | 1.3 (1.1–1.5) | 1.2 (1.0–1.6) | NS |
| Albumin (mg/dl) | 3.7 (3.3–4.1) | 3.7 (3.2–4.0) | 3.7 (3.4–4.3) | NS |
| Hematocrit (%) | 40 (37–44) | 40 (37–44) | 39 (37–43) | NS |
| Platelet Count (x10 3 /L) | 208 (177–256) | 202 (171–250) | 218 (183–258) | NS |
| Total Bilirubin (mg/dl) | 1.1 (0.7–1.5) | 1.2 (0.8–1.7) | 0.9 (0.7–1.2) | 0.006 |
| NT-proBNP (pg/ml) | 3163 (1656–5853) | 3744 (2573–7120) | 2369 (1012–3870) | <0.001 |
| Cardiopulmonary Exercise Testing | ||||
| Exercise Time (minutes) | 6.0 (4.1–8.0) | 5.3 (4.0–7.0) | 6.5 (4.3–9.1) | 0.001 |
| Respiratory Exchange Ratio | 1.08 (0.99–1.14) | 1.06 (0.98–1.13) | 1.10 (1.02–1.14) | NS |
| Peak VO 2 (ml/kg/min) | 11.3 (9.2–13.8) | 10.2 (8.7–12.5) | 13.3 (9.9–15.9) | <0.001 |
| %VO 2 | 41 (33–50) | 36 (31–43) | 48 (36–57) | <0.001 |
| VE-VCO 2 | 41.3 (34.6–49.4) | 45.3 (37.2–51.0) | 37.0 (32.2–46.1) | <0.001 |
| Invasive Hemodynamics | ||||
| Cardiac Index (L/min/m 2 ) | 2.0 (1.7–2.3) | 1.9 (1.6–2.2) | 2.2 (1.8–2.5) | <0.001 |
| PA Saturation (%) | 58 (51–63) | 55 (48–60) | 60 (55–64) | <0.001 |
| RA Pressure (mm Hg) | 10 (5–14) | 11 (7–14) | 8 (4–13) | NS |
| Mean PA Pressure (mm Hg) | 33 (25–40) | 35 (27–41) | 28 (19–36) | 0.005 |
| PCWP (mm Hg) | 22 (14–26) | 23 (16–28) | 19 (10–25) | 0.001 |
| PVR (Woods Units) | 2.6 (1.8–4.0) | 3.3 (1.9–4.4) | 2.4 (1.6–3.1) | 0.002 |
| Echocardiography | ||||
| Left Ventricular EF<25% | 120 (67%) | 72 (79%) | 48 (55%) | <0.001 |
| LVEDD (cm) | 6.5 (5.7–7.0) | 6.7 (6.1–7.3) | 6.1 (5.7–6.8) | 0.003 |
| RV Dysfunction (moderate-severe) | 51 (29%) | 28 (31%) | 23 (26%) | NS |
| Mitral Regurgitation (moderate-severe) | 68 (38%) | 40 (44%) | 28 (32%) | 0.006 |
| Tricuspid Regurgitation (moderate-severe) | 40 (23%) | 21 (24%) | 19 (22%) | NS |
Median follow-up until an event or censoring was 9 months (IQR 4 to 21), while the median potential follow-up was 24 months (IQR 11 to 39). At 18 months of follow-up, optimal medical management had failed in 52% of the cohort (97 patients) ( Table 1 ). Of these 97 patients, the total number of deaths was 19 (20%); 31 patients (32%) underwent LVAD implantation and 47 (48%) underwent cardiac transplantation.
There were no significant difference in age, proportion of women, race, or cause of cardiomyopathy between patients in whom medical therapy failed and those in whom it was successful ( Table 1 ). The 2 groups had similar baseline medication use, and nearly 80% of patients in each group were treated with implantable cardioverter-defibrillator therapy. Patients in whom medical therapy failed were more likely to have received cardiac resynchronization therapy and were noted to have lower left ventricular ejection fractions and higher left ventricular end-diastolic dimensions.
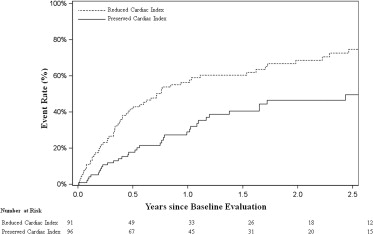
In the low CI group (<2 L/min/m 2 ), there were a total of 60 events at 2.5 years (75%) compared with only 35 events (50%) in the group with CIs ≥2 L/min/m 2 ( Figure 1 ). When analyzed as a continuous variable, a significant relation between CI and failure of optimal medical management was observed (p = 0.001; data not shown). Cox regression analysis was performed to examine the discriminatory capacity of CI. Variables considered for the regression analysis were age, exercise time, left ventricular end-diastolic diameter, %VO 2 , blood urea nitrogen, and creatinine. CI remained significant in the adjusted analysis, with a C index of 0.75 (p <0.006; Table 2 ). Percentage achieved of predicted VO 2 , but not peak VO 2 , demonstrated a robust statistical relation with optimal medical management failure, with a hazard ratio of 0.86 per 5% increase in %VO 2 .
| Parameter | HR | 95% CI | HR Represents: | χ 2 | p-Value |
|---|---|---|---|---|---|
| Cardiac Index | 0.94 | 0.86, 0.98 | 0.1 units increase | 7.62 | 0.006 |
| %VO 2 | 0.86 | 0.78, 0.96 | 5 units increase | 8.01 | 0.005 |
| LVEDD ∗ | |||||
| <5.7 cm | 0.68 | 0.48, 0.96 | 0.5 cm increase (<5.7) | 4.76 | 0.029 |
| ≥5.7 cm | 1.23 | 1.01, 1.37 | 0.5 cm increase (≥5.7) | 13.14 | <0.001 |
| Exercise Time | 0.89 | 0.81, 0.97 | 1 minute increase | 6.95 | 0.008 |
∗ This continuous variable was treated as a linear spline. The hazard ratios reported are for each piece of the spline.
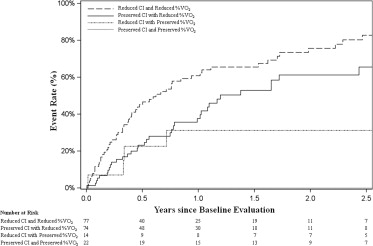
A primary aim of this study was to understand the impact of rest hemodynamics in the context of other clinical characteristics. From our multivariate analysis, CI and %VO 2 were identified as variables independently associated with failure of optimal medical management. Patients with preserved CI at rest (≥2 L/min/m 2 ) but reduced exercise capacity (%VO 2 <55%) were common in our cohort (n = 74 [40%]), and this profile was associated with a 2-year event rate of 61% ( Figure 2 ). Patients with this profile were similar to the other populations of patients in the study in terms of baseline characteristics, medication use, and laboratory studies ( Table 3 ). In contrast, patients with reduced CI at rest (<2 L/min/m 2 ) but preserved exercise capacity (%VO 2 ≥55%) were uncommon (n = 14 [8%]).
| Variable | Reduced CI and Reduced %VO 2 (n = 77) Median (IQR) or N (%) | Preserved CI with Reduced %VO 2 (n = 74) Median (IQR) or N (%) | Reduced CI with Preserved %VO 2 (n = 14) Median (IQR) or N (%) | Preserved CI and Preserved %VO 2 (n = 22) Median (IQR) or N (%) |
|---|---|---|---|---|
| Age (years) | 56 (46–62) | 56 (47–63) | 55 (51–67) | 57 (42–62) |
| Female | 22 (29%) | 17 (23%) | 3 (21%) | 13 (59%) |
| African-American | 28 (36%) | 29 (39%) | 5 (36%) | 5 (23%) |
| ICM | 29 (38%) | 37 (50%) | 3 (21%) | 8 (36%) |
| NYHA Symptom Class | ||||
| Class II | 16 (21%) | 23 (32%) | 7 (54%) | 7 (32%) |
| Class III | 42 (55%) | 43 (59%) | 6 (46%) | 14 (64%) |
| Class IV | 18 (24%) | 7 (10%) | 0 (0%) | 0 (0%) |
| Systolic BP (mm Hg) | 109 (102–120) | 116 (103–129) | 111 (95–120) | 126 (104–136) |
| Diastolic BP (mm Hg) | 74 (67–84) | 74 (67–83) | 76 (60–80) | 80 (65–92) |
| Heart Rate (BPM) | 76 (67–86) | 71 (62–85) | 76 (67–86) | 76 (67–86) |
| Medical Therapy | ||||
| ACE Inhibitors/ARBs | 64 (83%) | 61 (82%) | 13 (93%) | 20 (91%) |
| Beta Blockers | 67 (87%) | 69 (93%) | 13 (93%) | 20 (91%) |
| Aldosterone Antagonists | 52 (68%) | 42 (57%) | 10 (71%) | 13 (59%) |
| Digoxin | 35 (46%) | 30 (41%) | 4 (29%) | 7 (32%) |
| Long-Acting Nitrate | 3 (4%) | 11 (15%) | 1 (7%) | 2 (9%) |
| Hydralazine | 6 (8%) | 8 (11%) | 1 (7%) | 1 (5%) |
| Loop Diuretics | 67 (87%) | 66 (89%) | 14 (100%) | 18 (82%) |
| ICD | 62 (81%) | 58 (78%) | 10 (71%) | 17 (77%) |
| CRT | 44 (57%) | 24 (32%) | 2 (14%) | 7 (32%) |
| Laboratory Values | ||||
| Sodium (mmol/L) | 138 (136–140) | 138 (136–140) | 137 (136–139) | 139 (137–141) |
| BUN (mg/dl) | 22 (16–32) | 22 (15–27) | 22 (16–28) | 18 (14–21) |
| Creatinine (mg/dl) | 1.3 (1.1–1.6) | 1.3 (1.1–1.7) | 1.2 (1.0–1.4) | 1.1 (0.9–1.2) |
| Albumin (mg/dl) | 3.6 (3.3–4.0) | 3.7 (3.3–4.3) | 3.8 (3.6–4.0) | 4.0 (3.4–4.4) |
| Hematocrit (%) | 41 (37–44) | 38 (36–40) | 45 (44–49) | 39 (37–42) |
| Platelet Count (×10 3 /L) | 196 (170–239) | 208 (174–262) | 235 (193–248) | 229 (194–268) |
| Total bilirubin (mg/dl) | 1.3 (1.0–1.7) | 0.9 (0.7–1.2) | 0.9 (0.7–1.6) | 0.9 (0.6–1.1) |
| Pro-BNP (pg/ml) | 4372 (2469–6699) | 3096 (1694 –5294) | 1395 (890–3005) | 1949 (486–5836) |
| Cardiopulmonary Exercise Testing | ||||
| Exercise Time (minutes) | 5.3 (4.0–7.2) | 6.0 (4.1–7.2) | 7.3 (6.0–13.0) | 7.1 (6.0–11.4) |
| RER | 1.06 (1.00–1.13) | 1.08 (0.94–1.15) | 1.06 (1.04–1.13) | 1.13 (1.08–1.14) |
| Peak VO 2 (ml/kg/min) | 10.0 (8.6–12.1) | 11.0 (9.4–13.3) | 19.3 (13.6–22.2) | 18.7 (13.5–19.6) |
| %VO 2 | 36 (30–43) | 41 (33–46) | 67 (57–82) | 62 (56–71) |
| VE-VCO 2 | 46.7 (37.5–52.1) | 42.2 (34.6–48.6) | 34.6 (29.1–37.3) | 32.9 (30.0–35.6) |
| Invasive Hemodynamics | ||||
| RA Pressure (mm Hg) | 12 (9–17) | 8 (4–12) | 10 (4–12) | 7 (4–8) |
| Systolic PA Pressure (mm Hg) | 51 (41–64) | 45 (34–53) | 44 (37–52) | 33 (26–45) |
| Diastolic PA Pressure (mm Hg) | 26 (22–32) | 18 (14–24) | 20 (14–27) | 16 (12–22) |
| Mean PA Pressure (mm Hg) | 37 (30–45) | 29 (23–36) | 29 (25–36) | 25 (17–32) |
| PCWP (mm Hg) | 25 (21–29) | 17 (12–24) | 18 (15–26) | 14 (9–22) |
| Echocardiography | ||||
| Left Ventricular EF <25% | 56 (76%) | 44 (64%) | 10 (71%) | 10 (45%) |
| LVEDD (cm) | 6.7 (6.0–7.3) | 6.3 (5.8–6.9) | 6.8 (6.2–7.4) | 5.9 (5.4–6.8) |
| RV Dysfunction (moderate-severe) | 26 (35%) | 16 (24%) | 5 (36%) | 4 (18%) |
| Mitral Regurgitation (moderate-severe) | 34 (46%) | 23 (34%) | 7 (50%) | 4 (18%) |
| Tricuspid Regurgitation (moderate-severe) | 24 (32%) | 14 (21%) | 2 (14%) | 0 (0%) |
Stay updated, free articles. Join our Telegram channel

Full access? Get Clinical Tree


