Cardiovascular Physiology: Flow–Volume Loops
Understanding the factors that influence myocardial performance in normal and pathophysiologic states is essential for the cardiology boards. Myocardial performance is determined by the combined effects of ventricular preload, afterload, and contractility. A fourth factor, heart rate (HR), also plays a role in myocardial performance by influencing the duration of each cardiac cycle and the number of cardiac cycles per minute. Knowledge of how each of these factors responds to various disease states and therapeutic interventions provides the foundation upon which the practice of cardiovascular medicine is built.
DETERMINANTS OF MYOCARDIAL PERFORMANCE
Preload
Preload is the hemodynamic load on the myocardial wall (or the degree of stretch on the myocardial fiber) at the end of diastole, just prior to isovolumic contraction. The relationship between preload and myocardial performance was first described by physiologists Otto Frank and Ernst Starling over a century ago and is represented graphically by the Frank–Starling curve, which is discussed in greater detail in the next section. There are several experimental and clinical measures of left ventricular (LV) preload including (a) end-diastolic volume (EDV), (b) end-diastolic pressure (EDP), (c) wall stress at end diastole, and (d) end-diastolic sarcomere length. Conceptually, EDV is the most meaningful measure of ventricular preload. Clinically, EDP (by invasive measure of left ventricular end-diastolic pressure [LVEDP] or its surrogate, the pulmonary capillary wedge pressure, PCWP) is the most applicable.
Preload is predominantly determined by factors that influence venous return to the heart. Therefore, conditions that increase venous return such as volume resuscitation, supine body position, atrial contraction, skeletal muscle contraction, and decreased intrathoracic pressure (the result of deep inspiration) will increase preload, whereas conditions that decrease venous return will decrease preload. Examples of such conditions include decreased intravascular volume (severe anemia, dehydration, diuresis), venodilators (nitrates), upright posture, loss of atrial contraction (atrial fibrillation), increased intrathoracic pressure (Valsalva maneuver, positive pressure ventilation), and increased intrapericardial pressure (pericardial tamponade or constriction).
Afterload
Afterload is the resistance that the ventricle must overcome during contraction in systole. At the cellular level, it may be described as the tension in a myocardial fiber during active contraction. The relationship between afterload and myocardial performance is predicted by the force–tension relationship and is discussed in greater detail in the next section. Although there are several surrogate measures of afterload, the most commonly used are (a) central aortic pressure, (b) systemic arterial pressure, (c) systemic vascular resistance (SVR), (d) arterial impedance, (e) myocardial peak wall stress (affected by LV geometry), and (f) LV pressure. Conceptually, myocardial wall stress is the most applicable measure of afterload because it accounts for the influence of LV geometry in addition to LV pressure (see below). Clinically, measures of systemic pressure or SVR are more practical.
Myocardial peak wall stress reflects the maximum force required for the myocardium to overcome resistance and effectively expel blood during systole. This depends on the intraventricular pressure and the geometry of the left ventricle. Wall stress (σ), expressed in force per unit area of myocardium, is related to intraventricular pressure according to Laplace law:

where P is ventricular pressure, r is ventricular chamber radius, and h is ventricular wall thickness.
SVR and LV geometry are the primary determinants of afterload. However, valvular pathology such as aortic stenosis can influence afterload. Afterload is increased by increased blood pressure (hypertension, vasoconstricting drugs), increased LV radius (LV dilatation), reduced arterial elastance (atherosclerotic “stiff” arteries), and decreased wall thickness (eccentric hypertrophy, advanced cardiomyopathy). Afterload is decreased by decreased blood pressure (vasodilator therapy), increased arterial elastance, and thicker, smaller LV cavities.
Contractility
Contractility refers to the intrinsic “vigor” of the cardiac muscle. When loading conditions (preload and afterload) remain constant, increased contractility results in increased cardiac performance (stroke volume [SV]), whereas decreased contractility inhibits cardiac performance. The ejection fraction is a commonly used, though somewhat limited, surrogate for contractility. Contractility is a variable independent from loading conditions, whereas the ejection fraction can be affected by changes in preload and afterload. For this reason, the ejection fraction is really a better surrogate for SV, but since it does reflect contractility and has wide clinical availability, it remains the most popular surrogate for contractility. Contractility can be influenced by different drugs, and you are likely to encounter questions that are designed to assess your understanding of how drugs influence myocardial performance. Contractility (identified also as inotropy) is increased by drugs that alter the calcium/actin–myosin coupling mechanism. These drugs may be positive inotropes (catecholamines, phosphodiesterase inhibitors, digoxin) or negative inotropes (beta-blockers, centrally acting calcium channel blockers) (Table 4.1). The volume of myofilaments participating in the contraction process also has an effect on contractility. Contractility may increase in early aortic stenosis as the left ventricle hypertrophies, and it may decrease following the formation of scar after a myocardial infarction.
TABLE
4.1 Summary of Mechanisms of Action of Commonly Used Cardiovascular Drugs and Their Physiologic Effects
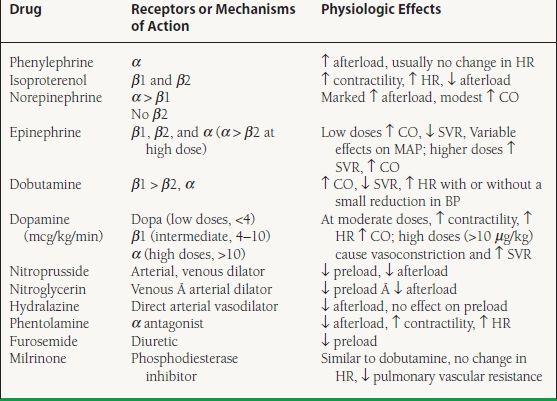
HR, heart rate; CO, cardiac output; SVR, systemic vascular resistance; MAP, mean arterial pressure.
Heart Rate
HR is a contributor to myocardial performance by virtue of its influence on cardiac cycle length and the number of cardiac cycles per minute. The principal determinants of myocardial performance are preload, afterload, and contractility, reflected clinically in the SV, the volume of blood expelled from the heart during one cardiac cycle. However, global performance of the heart is generally measured by the ability of the heart to meet the metabolic demands of the body. This is reflected in the cardiac output (CO) or cardiac index, defined by the following:
CO (L/min) = SV × HR
Cardiac index is simply the CO per unit of body surface area (BSA) (L/min/m2).
Thus, for a given SV, a faster HR results in a higher cardiac index and a slower HR results in a lower cardiac index. Under certain circumstances, HR may also influence myocardial performance during a single cardiac cycle. For example, tachycardia in a patient with severe LV hypertrophy and abnormal relaxation might shorten diastolic filling time and prevent complete isovolumic relaxation, resulting in ineffective preloading. Conversely, bradycardia in a patient with severe aortic regurgitation may overload the left ventricle by allowing a greater volume of regurgitation during diastole. Both conditions may result in reduced cardiac performance and pulmonary congestion, though for different physiologic reasons.
Myocardial Performance
Myocardial performance reflects the ability of the heart to meet the metabolic demands of the body. There are many surrogate measures of myocardial performance, but CO is arguably the most complete. CO can be assessed both invasively (thermodilution, Fick calculation) and noninvasively (echocardiography, cardiac magnetic resonance imaging [MRI]). As mentioned previously, the ejection fraction is a reasonable measure of SV. On the cardiology boards, expect to see SV or CO used in reference to myocardial performance.
GRAPHIC ILLUSTRATION OF MYOCARDIAL PERFORMANCE
The concepts of preload, afterload, and contractility can be represented graphically by the use of Frank–Starling curves, force–tension curves, and pressure–volume (PV) loops, respectively. These graphics allow the reader to visualize the interplay between the components of myocardial performance and understand how individual disease states and interventions alter myocardial performance. Expect to see these on the cardiology boards.
Starling’s Law and Frank–Starling Curves
Starling’s law dictates that cardiac performance (defined by SV) increases as preload is increased. However, there is a nonlinear relationship between EDP (a measure of preload) and SV, as shown in Figure 4.1. When afterload and contractility are held constant, reduced preload (shift along the line to the left) will reduce SV while increased preload (shift along the line to the right) will increase SV. However, if optimal preloading conditions are exceeded, the SV will no longer increase in response to higher filling pressure, which is depicted by the plateau of the curve.
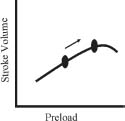
FIGURE 4.1 Frank–Starling curves. As preload increases, SV increases.


