Cardiovascular Magnetic Resonance and Computed Tomography of Coronary Artery Bypass Grafts


Cardiovascular Magnetic Resonance and Computed Tomography of Coronary Artery Bypass Grafts


Liesbeth P. Salm

Jeroen J. Bax

Hildo J. Lamb

Wouter J. Jukema

Albert de Roos


INTRODUCTION

Coronary artery bypass grafting (CABG) is a commonly performed surgical procedure for alleviation of symptoms and prolonging survival for patients with ischemic heart disease. Subsequent bypass graft disease occurs frequently, requiring coronary angiography for diagnosis. Coronary angiography is an invasive procedure that includes x-ray exposure, hospitalization, and a small risk of complications, including arrhythmias, coronary artery dissection, and cardiac death. A noninvasive diagnostic approach for the assessment of bypass graft anatomy and function is of great benefit. This chapter reviews the research that has been performed in evaluating bypass grafts noninvasively using cardiovascular magnetic resonance (CMR) and computed tomography (CT).


CARDIOVASCULAR MAGNETIC RESONANCE OF CORONARY ARTERY BYPASS GRAFTS


ANATOMY ASSESSMENT: ANGIOGRAPHY

During the past decades, a considerable amount of effort has been invested to achieve noninvasive visualization of the coronary arteries and bypass grafts with CMR. The larger size, straight course, and immobility during the cardiac cycle allowed the evaluation of graft patency even in the earliest studies, while assessment of the coronary arteries could not be achieved. In these initial investigations, two-dimensional (2D) spin-echo and gradient-echo techniques were applied to acquire successive axial slices during repetitive breath-holds (1,2,3,4,5,6,7 and 8). With the spin-echo technique the presence of blood flow is depicted as an absence of signal. If absence of signal at different levels of the bypass graft occurred, the graft was considered to be patent. In contrast, flowing blood is depicted as a bright signal during imaging with gradient MR techniques. As shown in Table 23.1, both acquisition techniques have been evaluated in several studies with conventional angiography as the standard of reference, demonstrating sensitivities and specificities varying from 71% to 100% and 88% to 100%, respectively. Pooled analysis of these eight studies (with 180 patients and 381 grafts) revealed a weighted mean sensitivity and specificity of 81% and 94%, with inclusion of 95% of grafts. Despite these promising results in the distinction between patent and occluded grafts, these 2D techniques were still limited by their low signal-to-noise ratio and low spatial resolution.

Substantial progress in image quality was achieved by the development of three-dimensional (3D) imaging techniques, allowing the acquisition of volume slabs with several thin slices, which resulted in a higher spatial resolution. To improve patient comfort, navigator techniques have been developed that permit real-time monitoring of diaphragm motion and free-breathing during data acquisition. In addition, improved enhancement of blood/muscle contrast can be expected by the administration of intravascular contrast agents. An example of a typical MR angiography (MRA) acquisition protocol with navigator respiratory gating is depicted in Figure 23.1. In Figure 23.2 an example of a patent, nonstenosed vein graft as confirmed by conventional angiography is provided. Pooled analysis of nine studies using 3D techniques, with over 200 patients included, revealed a slight increase in weighted sensitivity from 81% to 85%, with no loss in specificity (9,10,11,12,13,14,15,16 and 17) (Table 23.1). No difference in diagnostic accuracy for the evaluation of graft patency was noted between arterial and vein grafts. The sensitivity and specificity of arterial grafts were 85% and 95% as compared to 86% and 93% in vein grafts, respectively (10,11,13,14,15,16 and 17). An initial study was performed to assess graft patency postoperatively with MRA at 3 Tesla (T) (18). MRA confirmed all grafts to be patent; however, no comparison with invasive angiography was made. An example of MR angiogram at 3 T from this study is shown in Figure 23.3. These studies illustrate the potential of MRA to evaluate graft patency in clinical routine. Its safe and noninvasive nature in combination with the high specificity (˜94%) and negative predictive value (˜96%) suggests that in patients presenting with recurrent complaints after bypass grafting, MRA may function as a first-line investigation tool to rule out graft occlusion prior to more invasive diagnostic procedures.


TABLE 23.1 Assessment of Patency in Vein and Arterial Grafts by MR Angiography Compared with Invasive Angiography


Author


Patients


Grafts


Graft Type


MR Technique


Evaluable Grafts (%)


Sensitivity (%)


Specificity (%)


White et al. (4)


25


72


Vein


2D SE


90


72


91


Rubinstein et al. (6)


20


47


Vein


2D SE


100


72


90


Jenkins et al. (3)


22


45


Vein


2D SE


100


73


89


Frija et al. (2)


28


52


Vein and arterial


2D SE


100


71


97


White et al. (5)


10


28


Vein and arterial


2D GE


100


86


93


Aurigemma et al. (1)


20


45


Vein and arterial


2D GE


100


100


88


Vanninen et al. (7)


8


8


GEA


2D GE


100


100


100


Galjee et al. (8)


47


84


Vein


2D SE


92


84


98


2D GE


92


88


98


WEIGHTED MEAN 2D


95


81


94


Kessler et al. (9)


8


21


Vein and arterial


3D NAV


90


100


87


Engelmann et al. (10)


16


55


Vein and arterial


3D CE


100


85


95


Vrachliotis et al. (11)


15


45


Vein and arterial


3D CE


98


93


97


Wintersperger et al. (12)


27


76


Vein and arterial


3D CE


100


81


95


Kalden et al. (13)


22


59


Vein and arterial


3D CE


100


93


93


Molinari et al. (14)


18


51


Vein and arterial


3D NAV


96


92


97


Langerak et al. (15)


38


56


Vein


3D NAV


100


83


98


Wittlinger et al. (16)


34


82


Vein and arterial


3D NAV


90


78


96


Bunce et al. (17)


34


79


Vein and arterial


3D CE


100


73


85


WEIGHTED MEAN 3D


96


85


94


SE, spin-echo; GE, gradient-echo; GEA, gastroepiploic artery; NAV, navigator; CE, contrast-enhanced.


In addition to assessment of patency, few attempts have been made to evaluate graft stenosis. A sensitivity and specificity of 82% and 88% was observed for the detection of >50% luminal narrowing in vein grafts (15). The number of evaluable grafts was 50 of 56. In contrast, a discouraging sensitivity of 38% was reported (13). Evaluation of graft stenosis remains difficult due to the presence of metallic clips, stents, or calcifications in the course of the graft, which may cause signal voids. Since the presence of graft stenosis rather than occlusion may be the cause of recurrent complaints and the remaining nongrafted coronary vasculature cannot be evaluated in sufficient detail in a single MR session at this stage, the value of MRA to evaluate graft stenosis needs to be further explored before this technique can be recommended for routine use.


FUNCTIONAL ASSESSMENT: FLOW VELOCITY

Flow through a blood vessel may or may not be impaired by a stenosis, visualized by angiography (19,20). The assessment of blood flow through coronary arteries and bypass grafts has gained wide attention. To evaluate the hemodynamic impairment of a lesion, flow is measured at rest and during pharmacologically induced stress with adenosine or dipyridamole (21). By dividing the flow value during stress by the flow value at rest, the coronary flow reserve (CFR) is calculated (22,23). Flow-limiting stenoses cause a compensatory vasodilation at rest to maintain sufficient blood flow to the myocardium. As a consequence, the blood vessel cannot respond adequately to an increase in absolute flow by vasodilation during stress and CFR will be reduced. At first, blood flow was determined by Doppler flow transducers at open-chest procedures (19,22,23,24,25 and 26), limiting extensive use of CFR in clinical practice. When the diameter of intravascular catheter-based Doppler ultrasonographic devices could be reduced to 0.018 in., it became feasible to measure the velocity of the blood flow and calculate the coronary flow velocity reserve (CFVR) for coronary arteries in patients during catheterization. Blood flow correlated well with Doppler-derived velocity of blood flow both in vitro and in vivo (27,28 and 29). Invasive Doppler-derived CFVR has proven its potential in numerous clinical applications, such as in identifying hemodynamic significant stenoses in native coronary arteries and vein grafts (30,31), in the functional assessment of stenoses of intermediate severity (32), in the determination of the need for and the outcome after coronary intervention (33,34 and 35), and in the prediction of restenosis (36).


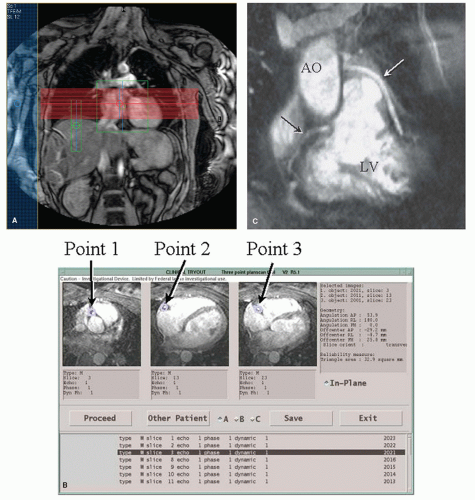
Figure 23.1. Example of a typical MR angiography (MRA) acquisition protocol. A: Typical planscan for coronary MRA. The red lines represent the axial imaging volume, the large green box is the volume used for localized shimming, the rectangular green box is the position in the right hemidiaphragm of the respiratory navigator, and the blue box is the position of a saturation band for suppression of image artifacts. B: Based on axial scout images, the three-point planscan is used to select three points in space, one at the origo of the coronary artery or bypass graft, one at the most distal point, and one in the middle of the first two points. From this information, an imaging plane is automatically calculated in plane with the coronary artery or bypass graft of interest. C: MRA of a patient with a bypass graft to the left coronary system (white arrow) and a visible native right coronary artery (black arrow). This imaging approach can be used clinically to assess bypass graft patency. AO, aorta; LV, left ventricle.


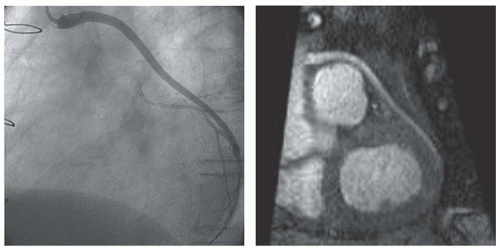
Figure 23.2. Example of an MR angiogram of a vein graft (right panel) in comparison with a coronary angiogram (left panel). A free-breathing, 3D, navigator-gated sequence was used for acquisition, here shown in a multiplanar reformat reconstruction.


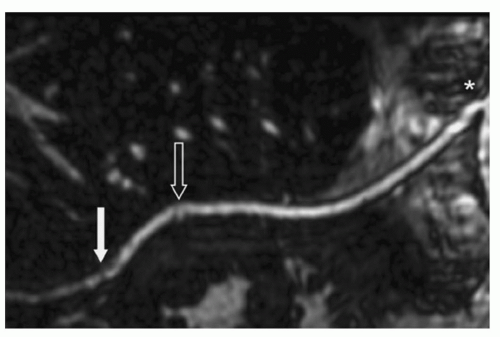
Figure 23.3. 3-T MR angiographic image (curved reconstruction) using an intravascular contrast agent for saphenous vein bypass graft visualization. There is no evidence of stenosis. The bypass graft is patent from the proximal aortic anastomosis (asterisk) to the distal anastomoses with the left coronary artery (arrow: Diagonal artery; open arrow: Marginal artery). (Reproduced with permission from: Hoppe H, Reineke D, Rosskopf AB, et al. Morphological and functional 3-Tesla magnetic resonance imaging of saphenous vein coronary artery bypass grafts. Interact Cardiovasc Thorac Surg. 2011;12:582-585.)

With the use of CMR, blood flow velocity can be measured using phase-contrast, velocity-encoded sequences (37). To use such a sequence accurately, an imaging plane is planned perpendicular to the target vessel. Throughout the cardiac cycle, the acquisition yields anatomic modulus images paired with phase images, in which every pixel contains a different velocity value. Volume flow (mL/min) can be obtained by calculating the integrated volumetric flow rate of all pixels in the vessel lumen per heartbeat and multiply it with the heart rate. To display the flow pattern, a flow rate-versus-time graph is drawn. Alternatively, the central peak velocity (cm/sec) can be obtained by selecting several pixels in the vessel center. Figure 23.4 depicts a typical example of a CMR examination with velocity mapping in a vein graft.


Early Magnetic Resonance Studies in Vein Grafts

For vein grafts, feasibility to quantify flow and characterize the flow pattern noninvasively by CMR was demonstrated (38,39). In an early study graft flow <20 mL/min and a loss of the biphasic flow pattern, typical for bypass grafts, would indicate a dysfunctional graft (40). In another
study adequate biphasic flow profiles could be obtained in 62 of 73 angiographically patent grafts (8). A significant difference in flow between single and sequential grafts to three vascular regions was demonstrated. These early vein graft flow studies were limited by the use of a gradient-echo sequence with limited spatial resolution (1.9 × 1.2 × 5 mm3) and no compensation for respiratory motion on 0.5- to 0.6-T magnets.


Early Magnetic Resonance Studies in Arterial Grafts

Feasibility to quantify flow in native and grafted internal mammary arteries (IMAs) was demonstrated using a free-breathing gradient-echo sequence on a 1.5-T MR scanner (41). A large intersubject variation of IMA graft flow (range: 28 to 164 mL/min) was observed. Mean flow and peak velocity were lower in IMA grafts compared with native IMAs. In a different feasibility study, respiratory motion was compensated using a breath-hold, segmented k-space, gradient-echo sequence to quantify velocity in native and grafted IMAs (42). Comparison with a free-breathing technique in native IMAs demonstrated a higher peak velocity using the breath-hold sequence because of elimination of respiratory motion artifacts and averaging of velocities. This sequence allowed imaging time to decrease from approximately 4 minutes at free breathing to a 20-second breath-hold. By means of a view-sharing reconstruction, an effective temporal resolution of 64 milliseconds could be obtained, allowing an acquisition of 7 to 13 temporal phases per cardiac cycle.


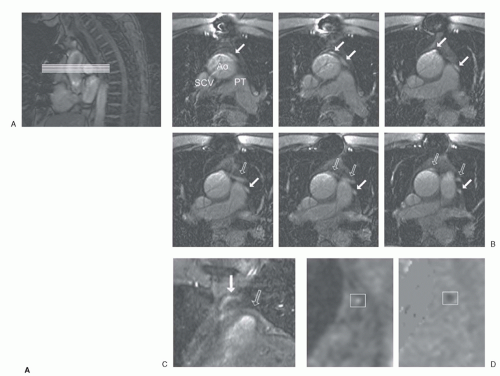
Figure 23.4. Example of an MR flow velocity study. A: Panel A shows a sagittal scout scan, on which the transversal survey scans at the level of the ascending aorta are planned. Panel B depicts the transversal survey scans showing two vein grafts, one to the circumflex region (arrows) and one to the left anterior descending artery (open arrows). Ao, aorta; PT, pulmonary trunk; SCV, supracaval vein. Panel C shows a coronal, oblique survey scan of the two vein grafts. Two differently orientated survey scans are used to plan the flow velocity scan. Panel D illustrates the flow velocity scan (modulus and phase image) in mid-diastole of the first graft at rest, which is used to obtain volume flow. (Reproduced with permission from: Salm LP, Vliegen HW, Langerak SE, et al. Evaluation of saphenous vein coronary artery bypass graft flow by cardiovascular magnetic resonance. J Cardiovasc Magn Reson. 2005;7:631-637.)


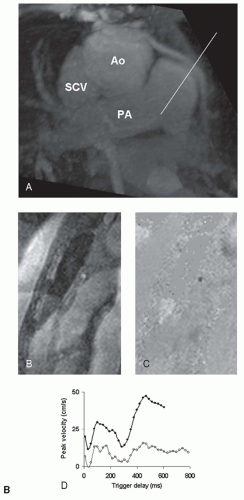
Figure 23.4. (continued) B: One of the survey images is depicted, visualizing a vein graft in plane (Panel A). Panels B and C show the modulus and phase images. The graft is pictured as a white, respectively black spot in the center of the image. In every image in the cardiac cycle 4 pixels in the center of the graft are selected to obtain a velocity curve (Panel D; white dots: Resting curve). The MR flow velocity acquisition is repeated during adenosine-induced stress to obtain the stress velocity curve (black dots). Ao, aorta; PA, pulmonary artery; SCV, supracaval vein.


Angiographically Controlled Magnetic Resonance Studies in Vein and Arterial Grafts

To evaluate the diagnostic value of MR flow velocity in bypass grafts, several angiographically controlled studies were performed. With the use of breath-hold sequences, flow measurements at rest and during pharmacologically induced stress with determination of CFR in bypass grafts were achieved. By the use of a breath-hold turbo-field echo-planar imaging sequence, a significant increase at stress for flow and velocity parameters was observed and CFR (mean 2.7 ± 1.1 for single grafts) could be calculated (43). A significant difference between grafts with <50% and >50% stenosis was demonstrated for MR-derived average and diastolic peak velocity during stress (44).

The detection of >70% angiographic stenosis in IMA grafts by breath-hold MR flow velocity at rest and during stress was investigated (45). At CABG surgery, titanium clips were used to avoid metal artifacts at MR imaging. A significant difference between grafts with <70% and >70% stenosis was demonstrated for baseline mean blood flow and the diastolic-to-systolic velocity ratio. Threshold values of 35 mL/min for baseline mean flow and 1 for diastolic-to-systolic velocity ratio were proposed to separate IMA grafts with <70% and >70% stenosis with respective sensitivity and specificity of 86% and 94%, and 86% and 88%. CFR did not differ significantly between IMA grafts with <70% and >70% stenosis.

The value of MR flow in the prediction of vein graft disease was assessed (46). An algorithm was formulated combining baseline flow <20 mL/min or CFR <2 to detect grafts or run-offs with a significant stenosis (>50%) or a myocardial infarction in the graft vascular territory, yielding a sensitivity of 78% with a specificity of 80%. The algorithm was designed to exclude normal-functioning vein grafts from further invasive examinations. A different approach for the detection of stenotic vein and arterial grafts or recipient vessels by MR with velocity mapping was also formulated, in which single and sequential vein and arterial grafts were separately analyzed (47). Sensitivity and specificity for detecting single vein grafts with >70% stenosis were 96% and 92%, respectively. For sequential vein grafts sensitivity and specificity were 94% and 71%, respectively. A proposed cut-off point for separating <70% and >70% stenosis in single vein grafts was 1.43 for CFVR. Not enough stenoses in arterial grafts were present to formulate an adequate model.

The detection of graft disease was further improved by a combined approach with MRA and MR flow measurements, which showed a sensitivity and specificity of 95.2% and 96.8% for detecting significant stenoses (>50%) in IMA grafts and 100% and 97.8% in vein grafts (48).

These studies show that MR flow velocity assessment has potential to become a diagnostic tool in predicting patency and the presence or absence of significant stenosis in both vein and IMA grafts in daily practice. However, only if a full examination of all grafts and native coronary arteries in a single MR imaging session is feasible, then may this technique reach its full value.


Applied Studies Using Magnetic Resonance Flow Velocity in Bypass Grafts

Some studies were conducted using MR flow velocity as a tool to evaluate a certain procedure (surgical or percutaneous intervention) or noninvasive modality. A comprehensive approach of contrast-enhanced MRA, MR flow quantification at rest, and MR cardiac function assessment was used to evaluate the status of bypass grafts after CABG surgery (49,50). Patency of grafts was accurately assessed by this MR approach.

May 24, 2016 | Posted by in CARDIOLOGY | Comments Off on Cardiovascular Magnetic Resonance and Computed Tomography of Coronary Artery Bypass Grafts

Full access? Get Clinical Tree

Get Clinical Tree app for offline access